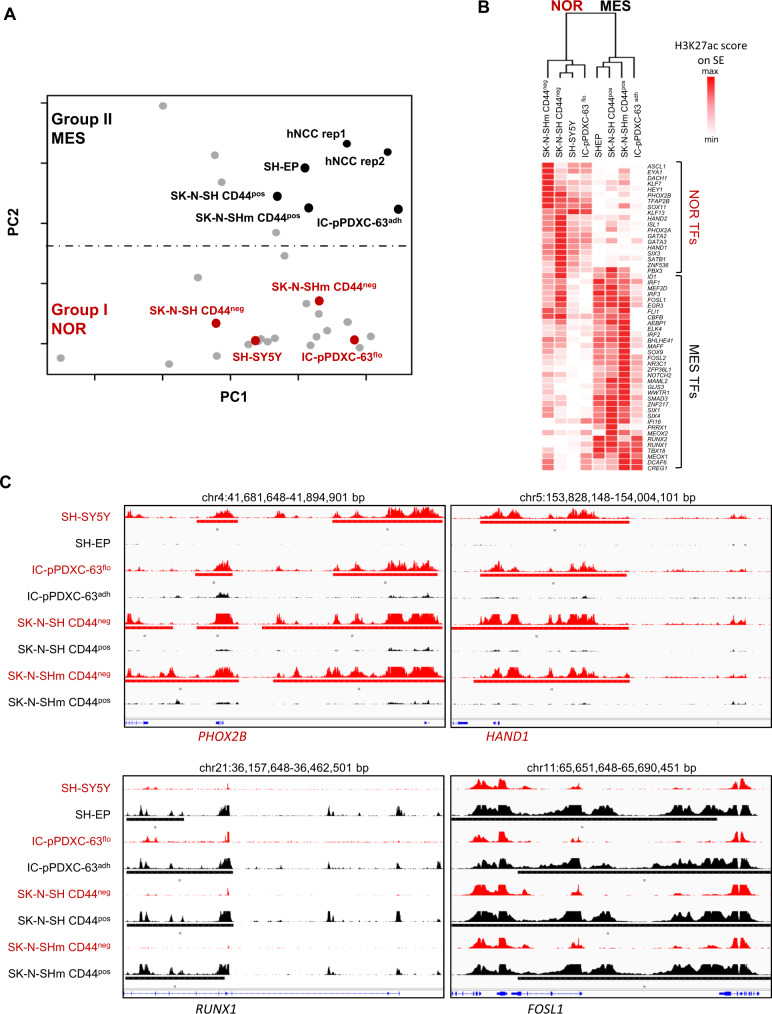
Fig. 4. The noradrenergic to mesenchymal plasticity is associated with an epigenetic reprogramming.
NOR noradrenergic, MES mesenchymal. A Principal component (PC) analysis based on neuroblastoma and hNCC super-enhancer log scores17 that discriminates the two neuroblastoma cell groups I (noradrenergic) and II (NCC-like/mesenchymal) and in which were added the floating and adherent cells of the IC-pPDXC-63 and CD44neg and CD44pos sorted cells of the SK-N-SH cell line. B Heatmap showing the H3K27ac signal on the super-enhancer regions of the transcription factors (TFs) of the noradrenergic and mesenchymal identities17,18 in the floating and adherent cells of the IC-pPDXC-63 cell line and in the CD44pos and CD44neg sorted cells of the SK-N-SH cell lines, and the SH-SY5Y and SH-EP control cell lines. For the TFs associated with several super-enhancers, the signal was summarized as described in the “Methods” section to have one value per TF. The unsupervised hierarchical clustering based on H3K27ac signals discriminated noradrenergic and mesenchymal cell identity. Source data are provided as a Source Data file. C IGV tracks of ChIP-seq profiles (scale 0-100) for H3K27ac at PHOX2B, HAND1, RUNX1, and FOSL1 super-enhancers in the SH-SY5Y, SH-EP, the floating and adherent IC-pPDXC-63 cells and the CD44pos and CD44neg sorted SK-N-SH and SK-N-SHm cells.

