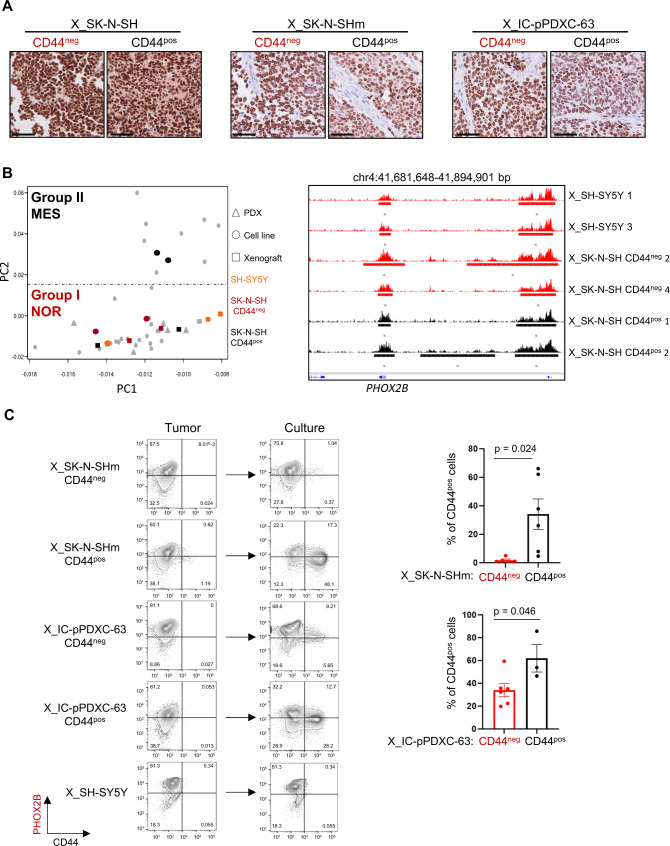
Fig. 5. Reversible mesenchymal to noradrenergic shift in the SK-N-SH and IC-pPDXC-63 models.
NOR noradrenergic, MES mesenchymal, X xenograft. A PHOX2B immunohistochemistry of one representative mouse xenograft per group (obtained from CD44neg or CD44pos sorted cells of SK-N-SH, SK-N-SHm and IC-pPDXC-63 cell lines). Scale bar = 50 µm. Similar results were obtained for all analyzed xenografts. B Left: PCA based on super-enhancer log scores17 as in Fig. 4A in which were added the xenografts of the SH-SY5Y and the xenografts of the CD44pos or CD44neg sorted cells of the SK-N-SH cell line. Right: tracks of ChIP-seq profiles (scale 0-100) for H3K27ac at PHOX2B super-enhancer in the xenografts of the SH-SY5Y and SK-N-SH cell populations sorted according to CD44 expression. C Left panels: FACS analyses using PHOX2B and CD44 marker expression gated on live cells after doublet exclusion comparing the profile of cells from the xenograft tumor at ethical size and the same cells cultivated until they reached confluence. Conditions are SK-N-SHm and IC-pPDXC-63 cells, CD44pos or CD44neg FACS sorted before engraftment in mice, and SH-SY5Y. Right panels: Quantification of CD44pos cells by FACS after culture, mean ± sd; n = 6 replicates except for X_IC-pPDXC-63 CD44pos n = 3, unpaired two-tailed t-test, *p < 0.05, each dot corresponds to one xenograft. Source data are provided as a Source Data file.

