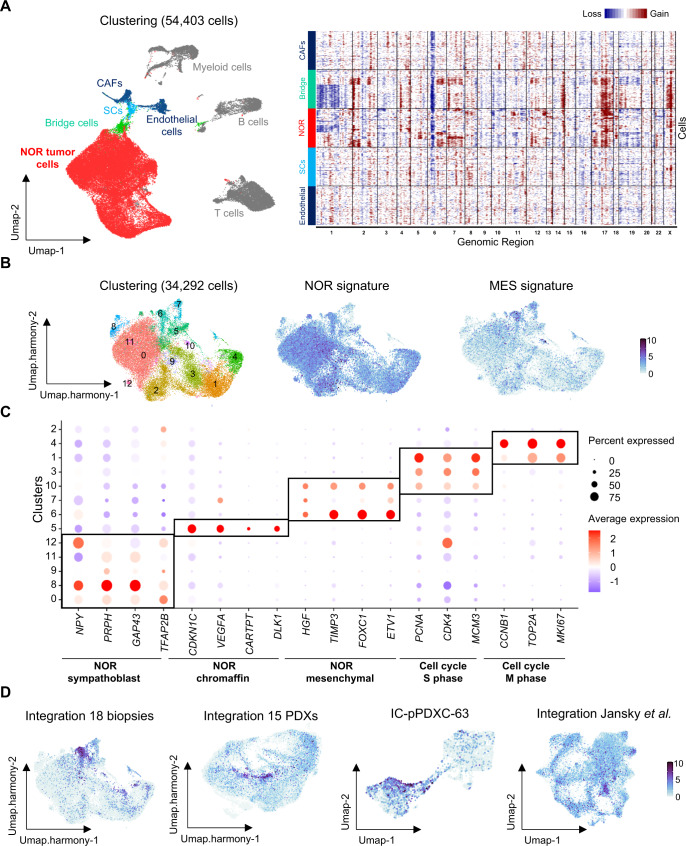
Fig. 6. Single-cell transcriptomic reveals a noradrenergic population with mesenchymal features in neuroblastoma patients.
NOR noradrenergic, MES mesenchymal. A (Left) Umap of the 54,403 cells from 18 biopsies integrated with Seurat. (Right) InferCNV analysis on 600 randomly selected cells from four clusters. Color code: gray = immune cells, dark blue = mesenchymal cells (endothelial cells and cancer-associated fibroblasts CAFs), light blue = Schwann cells (SCs), red = NOR tumor cells, green = bridge cells. B Umap of the clustering of the 34,292 tumor cells integrated with Harmony, extracted from the 18 biopsies. Plots of noradrenergic and mesenchymal transcription factor signatures17,18. C Dot plot graph illustrating cluster-specific gene expression. Three main tumor cell identities could be defined: noradrenergic tumor cells with either sympathoblast, chromaffin or mesenchymal features. D Plot of the signature identifying the noradrenergic cells with mesenchymal features composed of HGF, TIMP3, FOXC1, and ETV1 in the integration of single-cell RNAseq data of biopsies and PDXs, in the IC-pPDXC-63 cell line and in an independent cohort of 14 neuroblastoma cases already published13.

