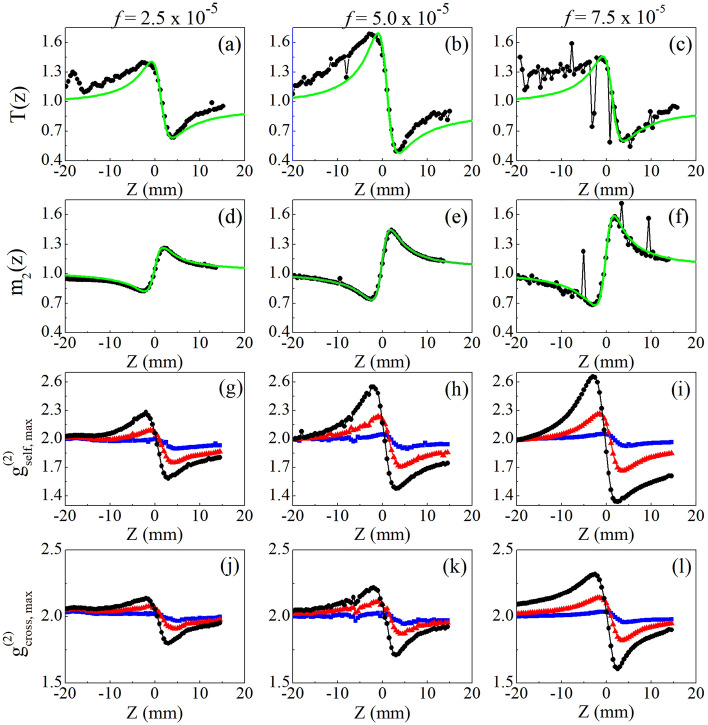
Figure 6.
Normalized (a–c) CA Z-scan, (d–f) D4σ and (g-l) IC-scan curves for Au-NR colloids obtained from 2D spatial intensity (g–i) self-correlation and (j–l) cross-correlation functions, for Au-NRs colloids with volume fractions of (a,d,g,j) 2.5 × 10⁻⁵, (b,e,h,k) 5.0 × 10⁻⁵, (c,f,i,l) 7.5 × 10⁻⁵ and incident intensities of 0.1 kW/cm2 (blue squares), 0.5 kW/cm2 (red triangles) and 1.1 kW/cm2 (black circles). The solid (green) lines in (a-f) represent the best fit using the nonlocal nonlinearity model. For presentation purposes, all IC-scan curves have been shifted vertically to start at .

