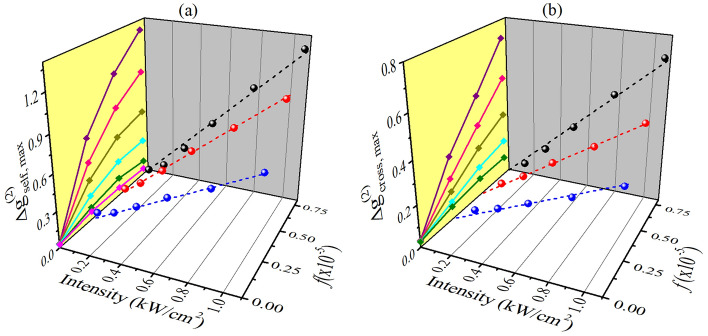
Figure 7.
Intensity and volume fraction dependence of peak-to-valley variation of IC-scan curves obtained for Au-NRs colloids using the 2D spatial intensity (a) self-correlation and (b) cross-correlation functions. In the yellow planes, the curves were built from the projection of the values of and versus f, for the different intensities. From top to bottom: I = 1.1, 0.8, 0.5, 0.3, 0.2 and 0.04 kW/cm2, the latter corresponding to the linear regime (used as a reference in the cross-correlation functions).

