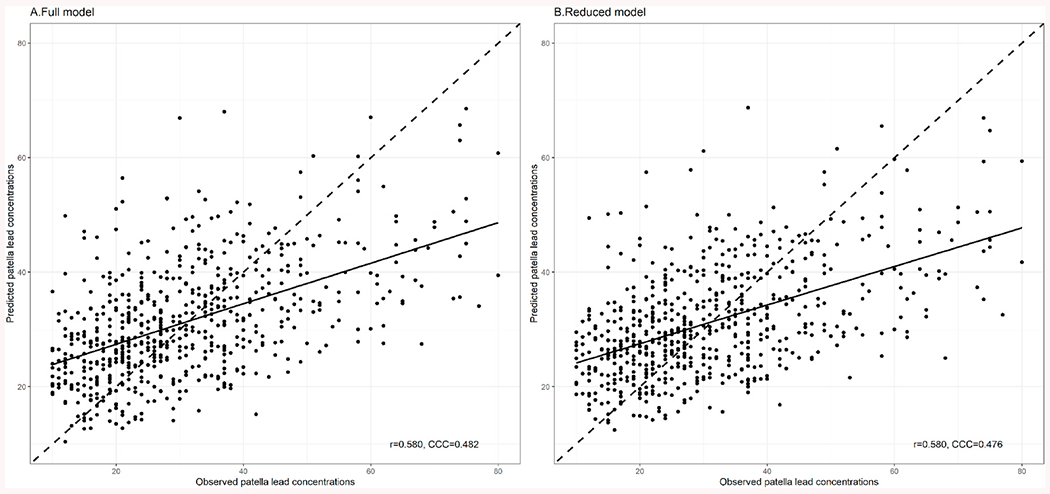
Fig. 3.

Validation of the patella lead prediction A. full model and B. reduced model in outer cross-validated testing sets. The solid lines drawn on the plots showed indicate the regression line from the simple linear regression. The dashed lines indicate the equiangular observed–predicted line. R: the Pearson correlation coefficient; CCC: the Concordance Correlation Coefficient. Full model included blood lead concentration (log-transformed), age, education, job type, weight, height, body mass index, waist circumference, smoking status, and cumulative cigarette smoking (pack-year). Reduced model included blood lead concentration (log-transformed), age, education, job type, body mass index, smoking status, and cumulative cigarette smoking (pack-year).
