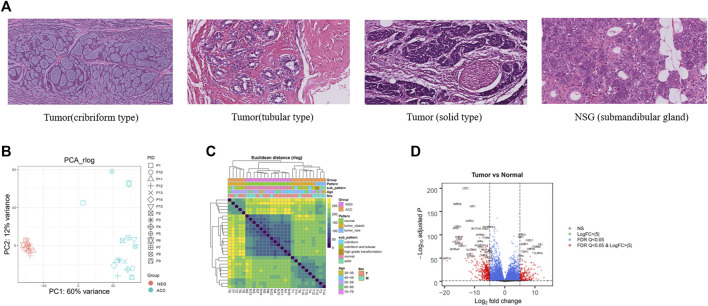
FIGURE 1.
H&E and DEGs between tumor and NSG tissues. (A) The histopathological features of the ACCs and NSG used in this study (H&E, 40x). (B) PCA plots showing clustering of 28 samples (13 NSG and 15 ACCs). (C) Sample distances showing clustering of 28 samples (13 NSG and 15 ACCs) (tumor_classic: ACC with a pathological type of cribriform-tubular and cribriform; tumor_rare: ACC with a pathological type of sold and high-grade transformation). (D) Volcano plot of the DEGs. The red (top) and blue (down) sites reflect the differentially expressed RNAs with log fold-change>│5│and PDR Q < 0.05.

