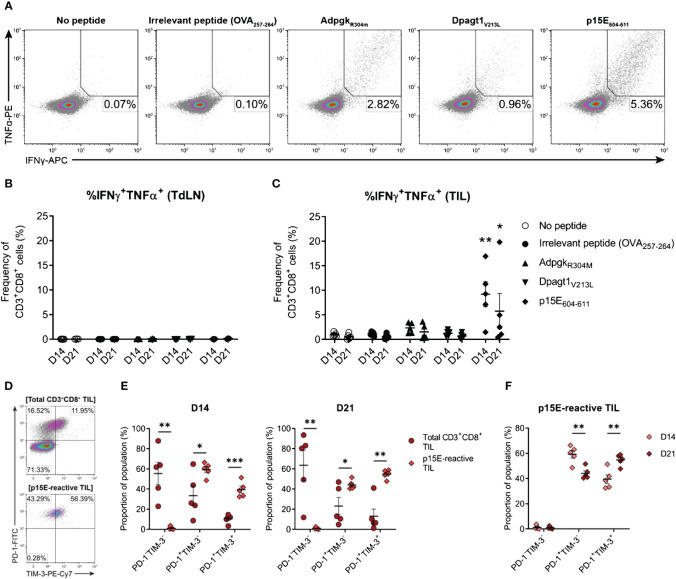
Figure 10.
The endogenous CD8+ T cell response to MC38 is dominated by recognition of the p15E tumour antigen. (A) Representative density plots showing TNFα and IFNγ production by CD8+ TILs stimulated ex vivo with BMDCs pulsed with 1 µg/mL of H-2Kb/Db-restricted tumour antigen peptides (p15E604-611, KSPWFTTL; AdpgkR304M, ASMTNMELM; and Dpagt1V213L, SIIVFNLL), unpulsed BMDCs (no peptide) or BMDC pulsed with 1 µg/mL OVA257–264 peptide (SIINFEKL; irrelevant peptide). Percentages indicate peptide-reactive CD8+ T cell frequencies (%IFNγ+TNFα+) as the proportion of total CD3+CD8+ cells. (B, C) Frequency of polyfunctional CD3+CD8+ cells – isolated from TdLNs (B) and TILs (C) – producing IFNγ and TNFα in response to indicated treatments (%IFNγ+TNFα+). (D) Representative density plots showing PD-1 and TIM-3 expression by total CD3+CD8+ TILs (top) and p15E-reactive CD3+CD8+ TILs (IFNγ+TNFα+, bottom) isolated from D21 MC38 tumours. Percentages indicate subset frequencies as the proportion of the gated populations. (E) Comparison of PD-1 and TIM-3 subset compositions in total CD3+CD8+ TILs (•) and p15E-reactive CD3+CD8+ TILs (♦) from D14 and D21 MC38 tumours. (F) Comparison of PD-1 and TIM-3 subset compositions in p15E-reactive CD3+CD8+ TILs from D14 and D21 MC38 tumours. All data are representative of five biological replicates per timepoint. Graphs represent the mean (line) and standard error of the mean (SEM, error bars). Statistical analyses were performed using two-way ANOVA with post-hoc Dunnett’s test, comparing tumour antigen peptide-reactive frequencies to irrelevant peptide controls (B, C), or multiple unpaired Student’s t-tests using the Holm-Sidak method to correct for multiple comparisons (E, F). *p ≤ 0.05; **p ≤ 0.01; ***p ≤ 0.001.

