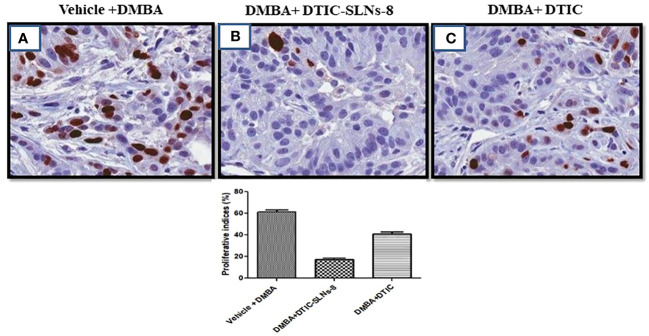
Figure 9.
(A) represents overexpression of Ki-67 in DMBA treated group. (B) indicating DMBA+DTIC-SLNs-8 decreases proliferative cells in the tumor section in DMBA-induced skin tumors. (C) representing the moderate downregulation of Ki-67 expression. Representative images micrographs of Ki-67 staining (nuclei stained with brown color) in the tumor section of experimental groups are shown. Bar graph is shown the percentage of proliferative cells by counting Ki-67 positive cells in 15 randomly selected microscopic (40× objective) fields in each group were calculated by the total number of cells divided by the number of Ki-67 positive cells. vehicle Control treated group; DMBA treated group; DMBA+ DTIC-SLNs-8 with Gellan gum (0.01%w/v); DMBA+DTIC with Gellan gum (0.01%w/v) Statistical analyses were performed with Student’s t-test *p < 0.01 compared with DMBA alone treated group.

