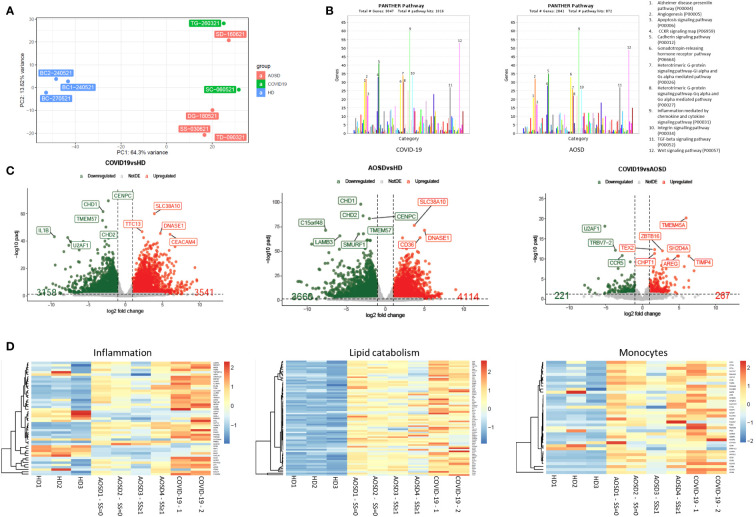
Figure 1.
Transcriptome analysis of peripheral immune cells from HDs, COVID-19 and AOSD patients. (A) PCA plot. PCA shows the sample in the 2D plane spanned by their first two principal components. (B) Pathway analysis by Pantherdb.org. Bar chart of enriched pathways in COVID19 and AOSD patients. (C) Volcano plots. Volcano plot representation of differential expression analysis of genes in COVID-19 vs HD, AOSD vs HD, and COVID-19 vs AOSD. Red and green points mark the genes with significantly increased or decreased expression (FDR<0.05). The x-axis shows log2fold-changes in expression and the y-axis the log odds of a gene being differentially expressed. (D) Transcriptome analysis from 3 HDs, 2 COVID-19 patients and 3 AOSD patients of genes involved in inflammation, lipid catabolism and monocytes. HD, healthy donors; AOSD, Adult-onset Still’s disease.

