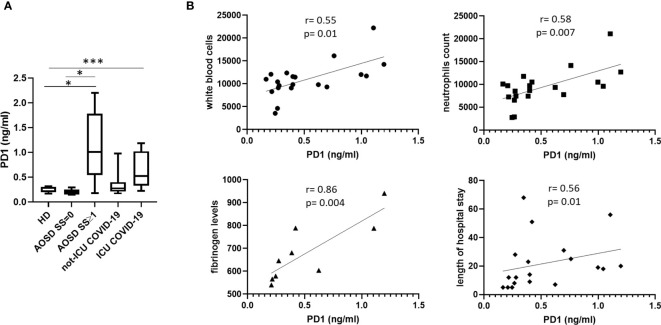
Figure 2.
Levels of protectin D1 in HDs, COVID-19 and AOSD patients. (A). Plasma levels of PD1 (ng/ml) in HDs (n=13) and patients affected by COVID-19 (not-ICU COVID-19, n= 11; ICU COVID-19, n=10) and AOSD (n=13) patients. Data are represented as box plots displaying medians, 25th and 75th percentiles as boxes, and 10th and 90th percentiles as whiskers. HD vs AOSD SS≥1, *p= 0.04; AOSD SS=0 vs AOSD SS≥1, *p=0.02; HD vs ICU COVID-19, p= 0.0006; not-ICU COVID-19 vs ICU COVID-19, *p= 0.02, *** p < 0.0001 (B) Correlation analysis between PD1 levels and white blood cells count, neutrophils count, fibrinogen levels and length of hospital stay in patients with COVID-19. Spearman correlation and linear regression coefficients are displayed. ICU, intensive care unit.

