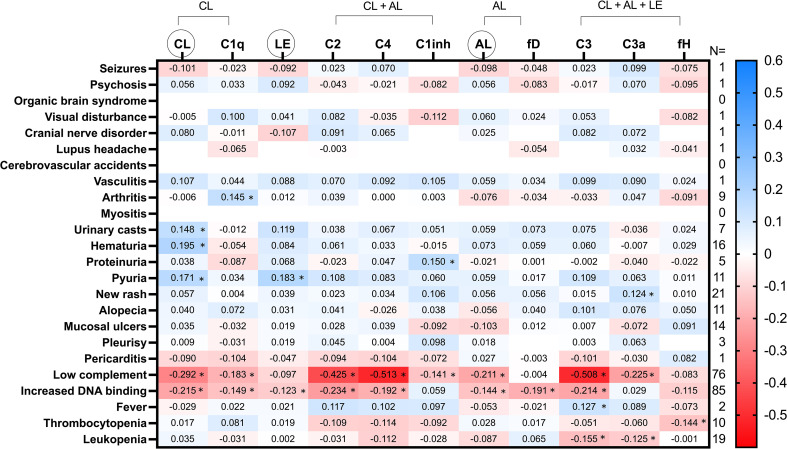
Figure 1.
Heatmap of SLEDAI-2K items relation to C pathways activation and serum molecules. Values in the cells represent Spearman’s rho coefficient (* denotes p value < 0.05). Positive and negative correlations are shown in blue and red, respectively. The number of patients who met each SLEDAI-2K Item is shown in the right margin. CL, classical; AL, alternative; LE, lectin; fD, factor D; fH, factor H. CL, LE and AL in circles refer to the functional tests of these cascades.

