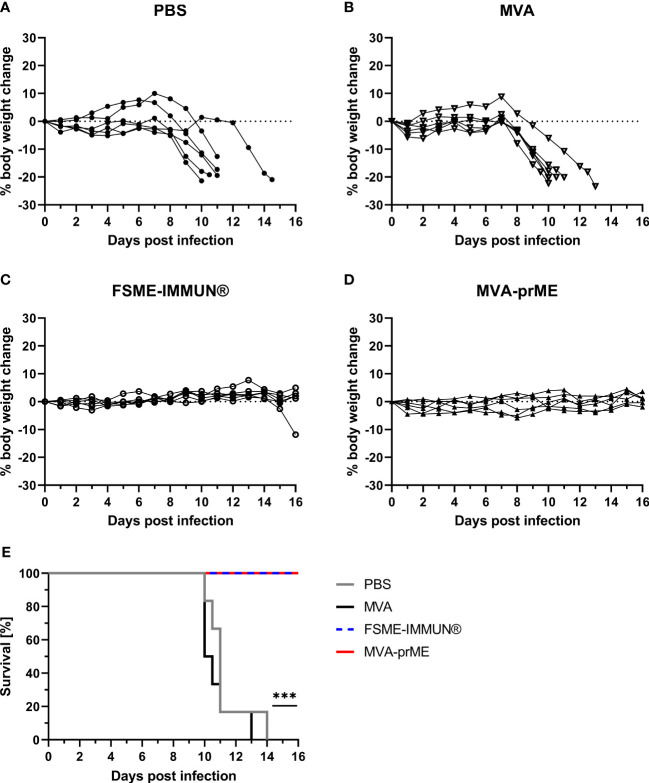
Figure 3.
Body weight change and survival curves of vaccinated and challenge infected mice. (A–D) Percentage of body weight change compared with initial body weight on the day of challenge during the entire course of TBEV infection for PBS- (A), MVA- (B), FSME-IMMUN®- (C), and MVA-prME-vaccinated (D) mice. (E) Kaplan–Meier curves showing the percentage of survival of mice vaccinated with PBS (gray), MVA (black), FSME-IMMUN® (blue, dotted), or MVA-prME (red) (n = 6, ***p≤0.001). p = 0.0007: FSME-IMMUN®/MVA-prME versus PBS, p = 0.0004: FSME-IMMUN®/MVA-prME versus MVA.

