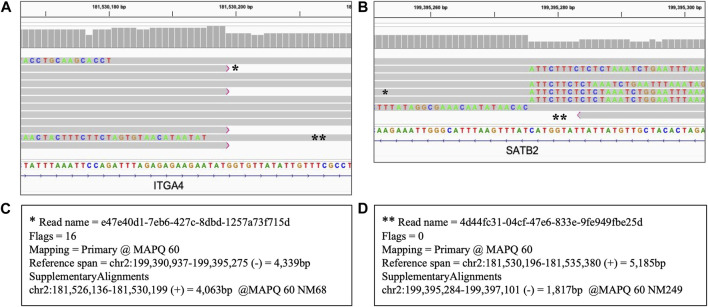
FIGURE 7.
Heterozygous inversion of 17.86 Mb seq[GRCh38] inv(2) (q31.3q33.1). Long read WGS of Sample_9. Each thick gray horizontal line represents a separate read. String of letters below the panels indicate reference nucleotide sequence, and colored nucleotides over the read sequences stand for the nucleotides not matching the reference; strings of mismatches of that kind reflect the regions that got disjoined from the original reference location. Panels A and B represent two ends (breakpoint) of the same variant with the same reads partially mapping to the reference sequence at both ends separated by distance and orientation (i.e., split reads). Two examples of such split reads are marked with * and ** respectively. Panels C and D display primary and supplementary alignments for different reads, i.e., detached parts of the same read mapping with the best score and the second best score respectively to the different positions. (A) Left breakpoint alignment view; (B) Right breakpoint alignment view; (C) Alignment details of the reads marked with * in panels (A) and (B). That read is mapped partially as a primary alignment at the left breakpoint coordinate and partially as a supplementary alignment in opposite orientation at the right breakpoint coordinate; (D) Alignment details of the read marked with ** in panels (A) and (B). That read is mapped partially as primary alignment at the right breakpoint coordinate and partially as a supplementary alignment in opposite orientation at the left breakpoint coordinate.

