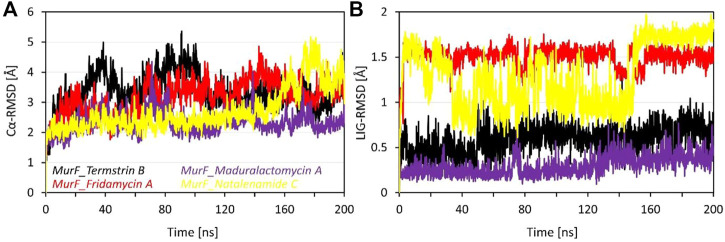
FIGURE 3.
Root means square deviation analysis of the MurF protein of A. baumannii after 200 ns of molecular dynamics simulations. Where (A) represents the line RMSD graph for Cα atoms of MurF protein while (B) represents the RMSD values of each compound with respect to its initial position within the active site. The line graph is enriched with colour-coded legends for each complex.

