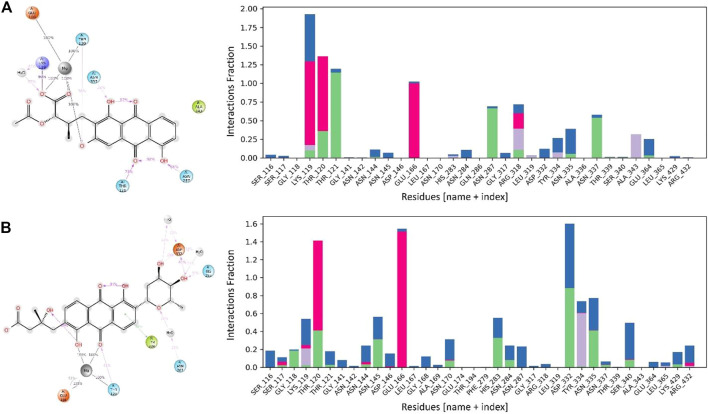
FIGURE 7.
The interaction patterns and the fraction of MurF protein in complex with (A) Termstrin B and (B) Fridamycin A through the simulation period. The Histogram plot shows the fraction interaction of each residue, and the colour codes show the type of interaction, i.e., the green colour represents hydrogen bonds, the grey colour represents hydrophobic interactions, the purple colour represents ionic interactions, and the blue colour represents the water bridges.

