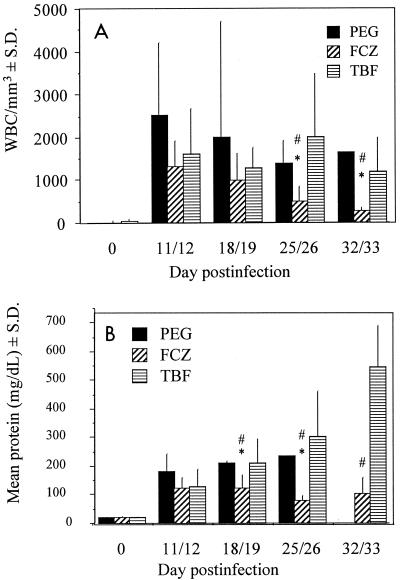
FIG. 3.
(A) WBC counts in CSF. The number of animals sampled at each of the time points shown were eight, eight, four, three, and one, respectively, for PEG-treated animals; nine, seven, six, six, and five, respectively, for TBF-treated animals; and eight at all times for FCZ-treated animals. ∗, P ≤ 0.01 for difference from PEG-treated animals within same sampling period; #, P ≤ 0.02 for difference from TBF-treated animals within same sampling period. (B) CSF protein concentrations. The number of animals sampled at each of the time points shown were seven, seven, eight, six, and eight, respectively, for FCZ-treated animals; seven, seven, six, five, and four, respectively, for TBF-treated animals; and eight, five, three, one, and zero, respectively, for PEG-treated animals. ∗, P ≤ 0.04 for difference from PEG-treated animals within same sampling period; #, P ≤ 0.03 for difference from TBF-treated animals within same sampling period.

