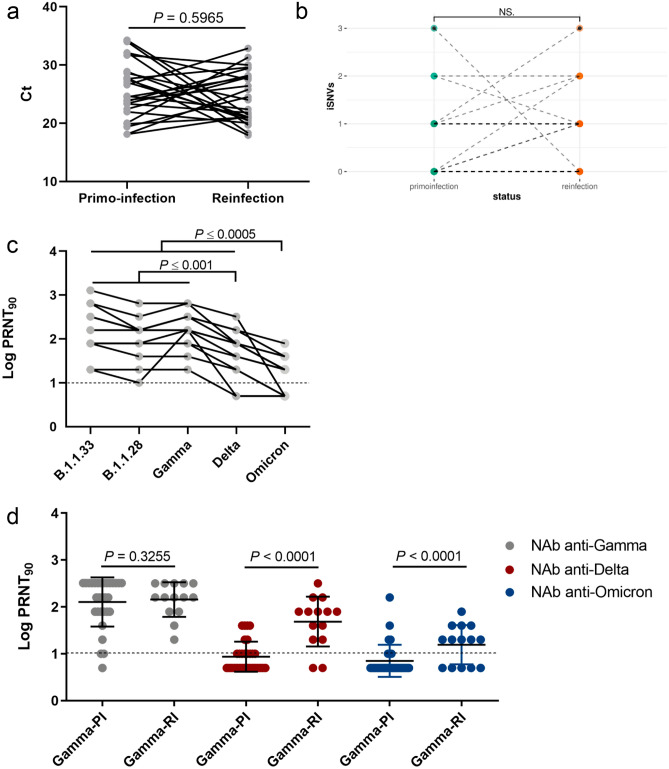
Figure 1.
Viral load in NPS samples and neutralization capacity of convalescent serum of reinfected individuals. (a) Real-time RT-PCR Ct value distribution of NPS SARS-CoV-2 positive samples taken from 25 individuals at primo-infection and reinfection. Each line represents a single individual. (b) Number of iSNVs at primo-infection and reinfection samples. Two-tailed P value was calculated with the Wilcoxon matched-pairs signed-rank test. NS Non-significant. (c) Individual trajectories of neutralization titers (PRNT90) against different SARS-CoV-2 lineages in convalescent plasma from 14 individuals collected 10–75 days following SARS-CoV-2 reinfection. Each line represents a single individual. (d) Comparison of neutralization titers (PRNT90) against VOCs Gamma, Delta and Omicron in convalescent plasma from hospitalized individuals primo-infected with Gamma (n = 30; Gamma-PI) and individuals reinfected with Gamma (n = 14; Gamma-RI). Horizontal bars represent sample medians and interquartile range. The dashed line indicates the detection limit of the PRNT90 assay. Two-tailed P values calculated with the Wilcoxon matched-pairs signed-rank test (a,b) or the Mann–Whitney test (c) are shown.

