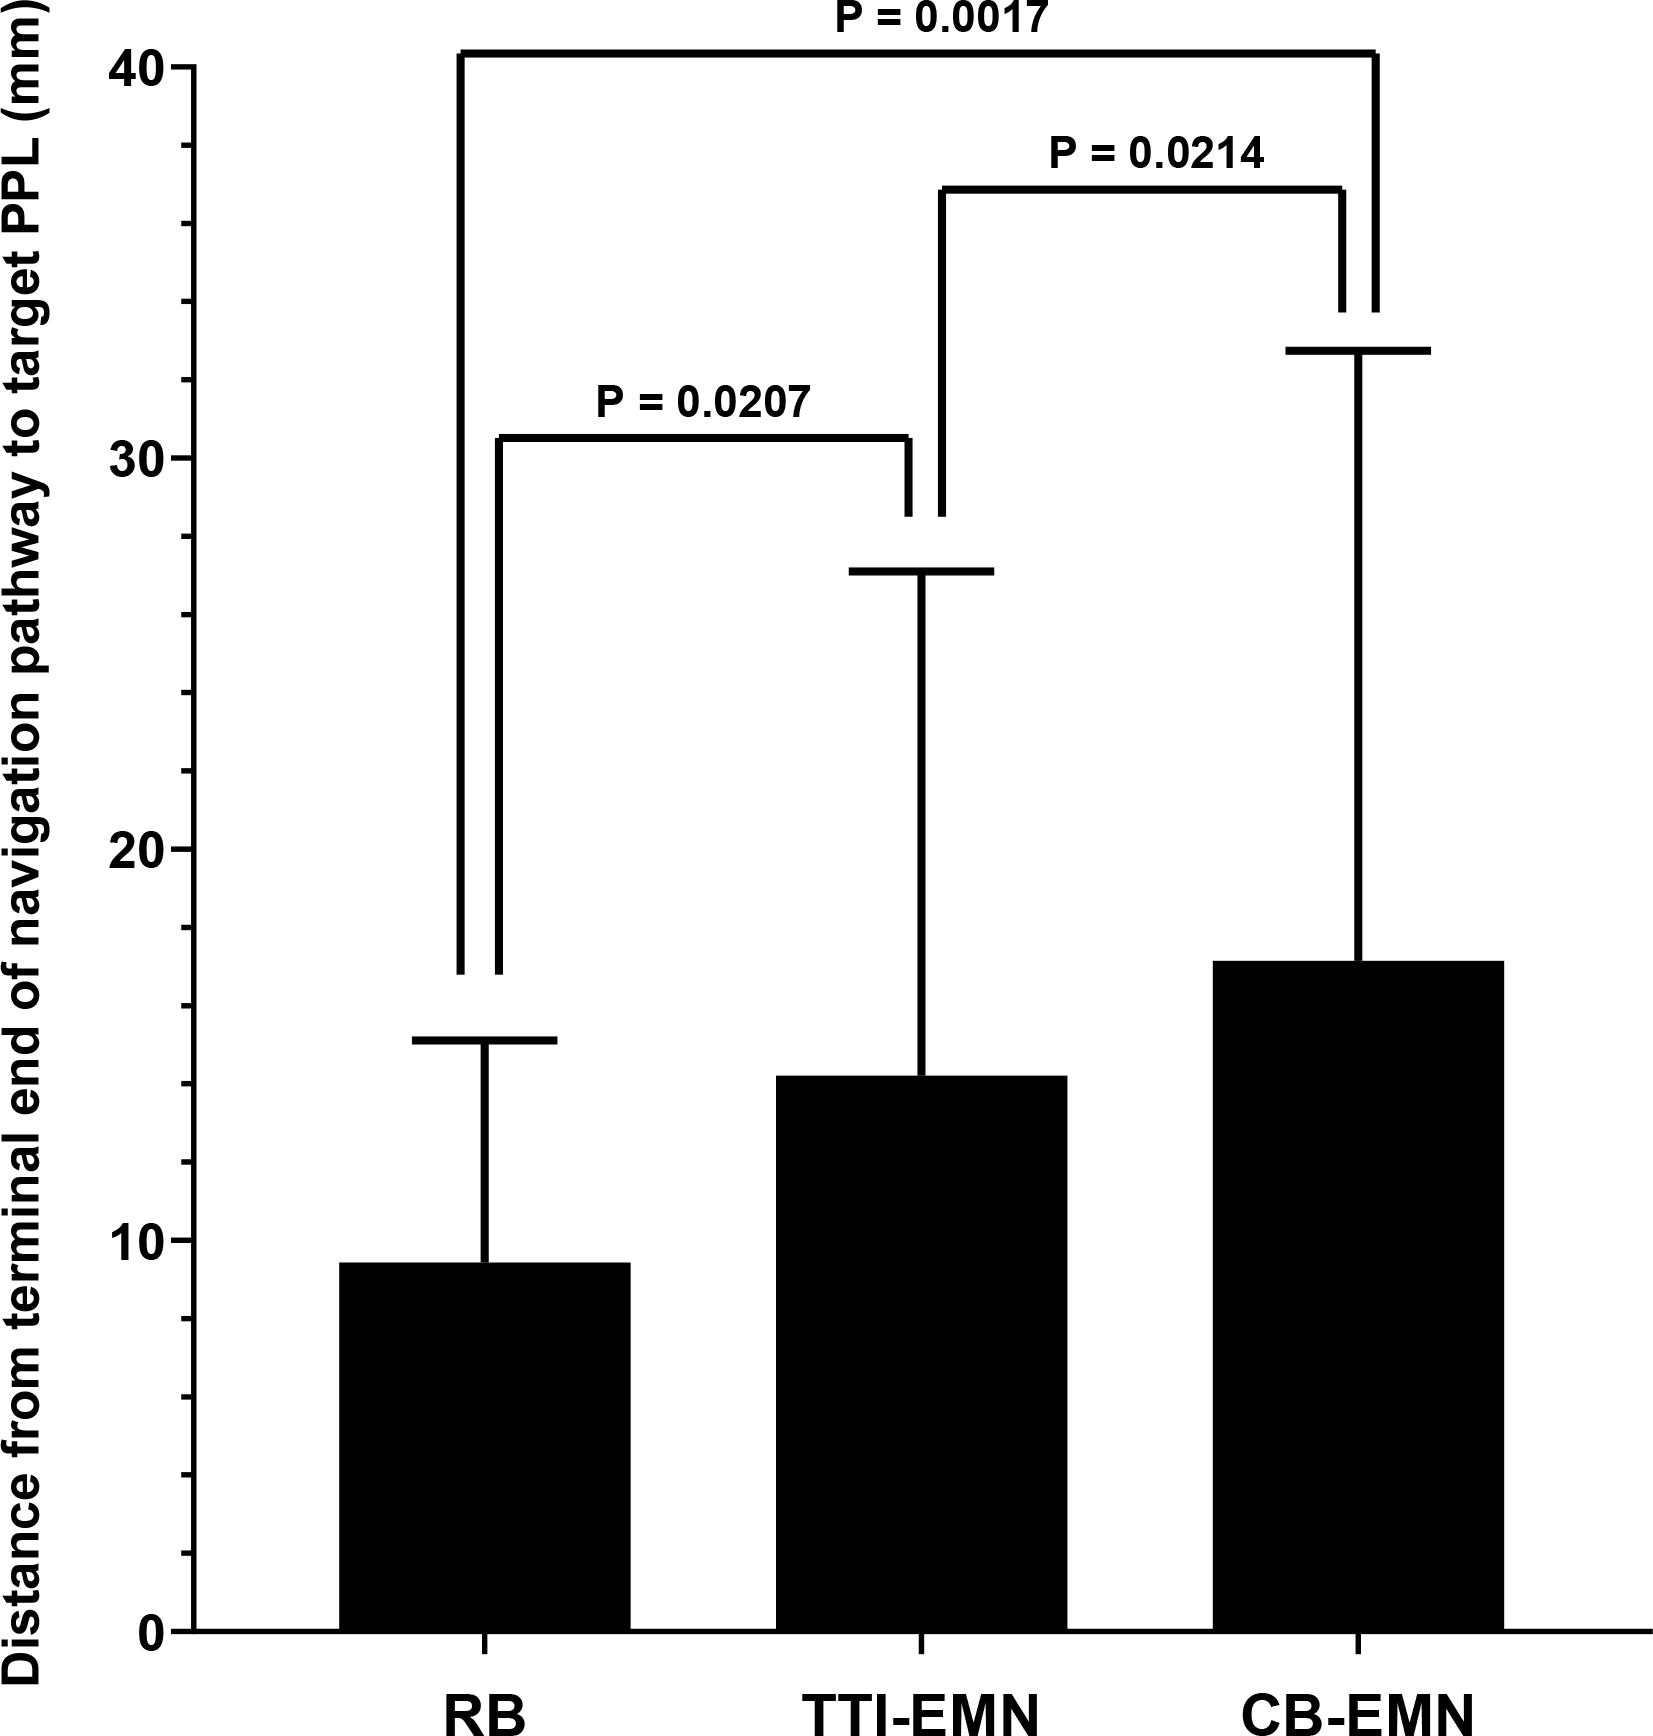
Figure 4.

Comparison of the mean distance from the terminal end of the virtually reconstructed navigation pathway to the target peripheral pulmonary lesion. Whiskers represent standard deviation. Mixed-effects ANOVA P = 0.0005. Post-ANOVA Tukey’s comparison P values are shown.
