Figure 5.

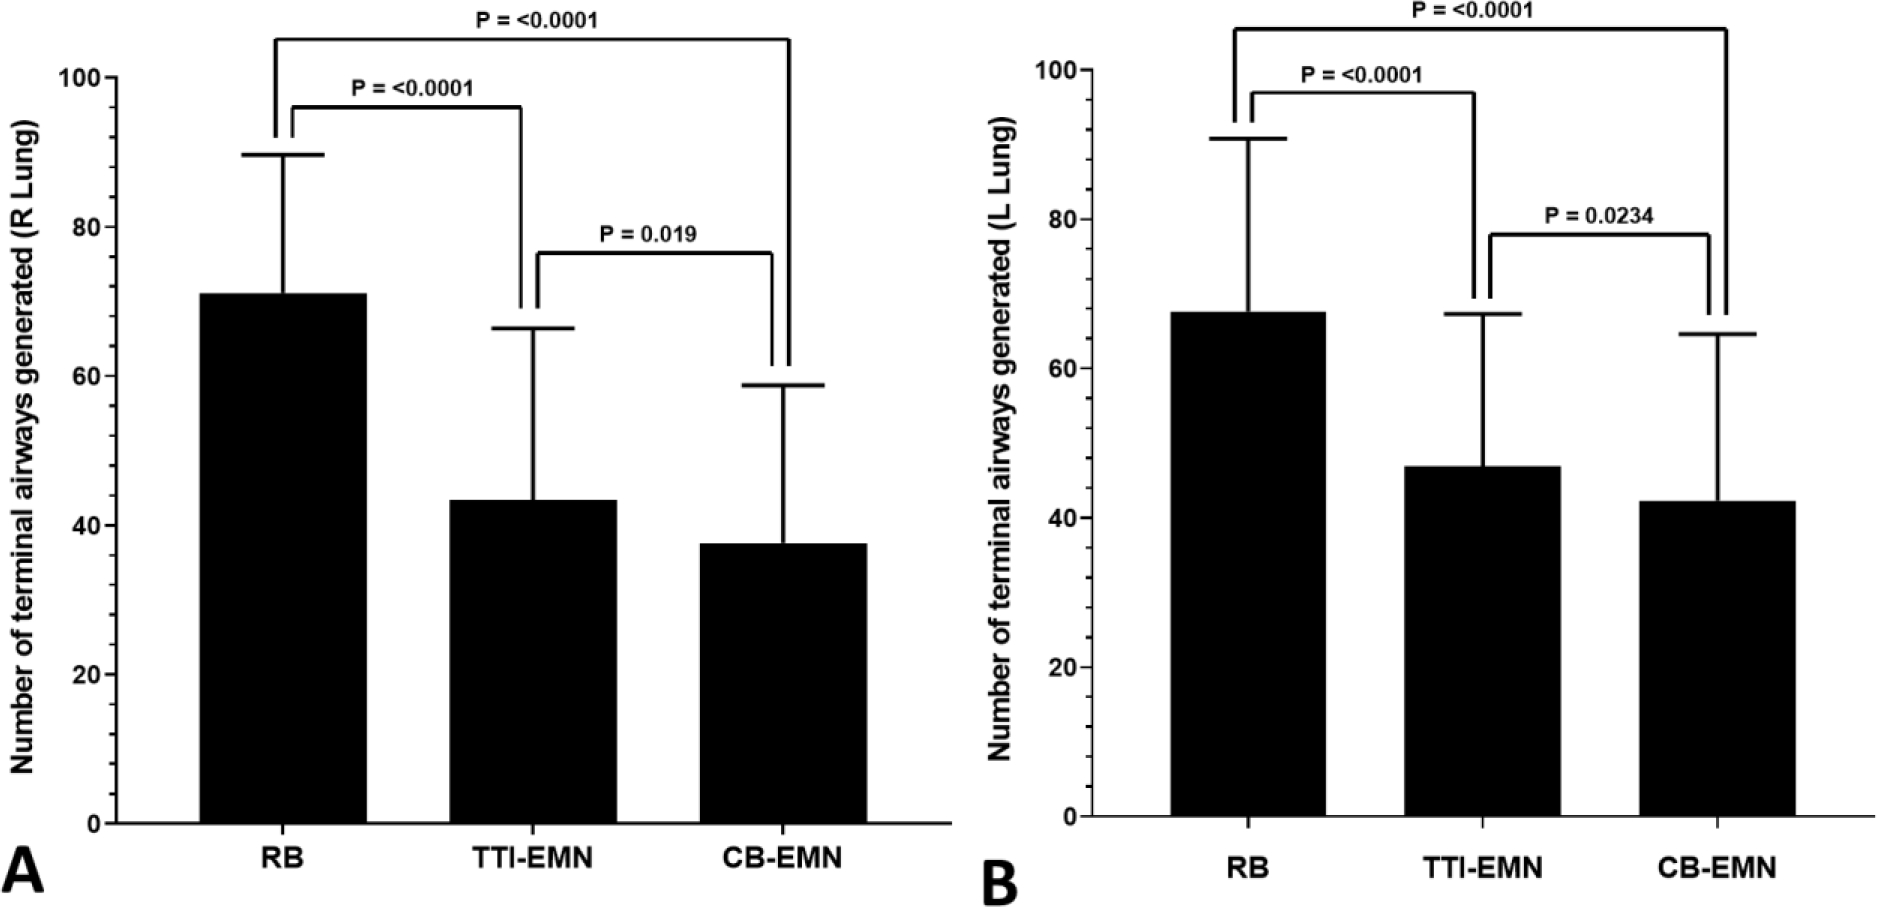
Comparison of mean terminal airway generation by lung. Whiskers represent standard deviation. A) Right lung, Mixed-effects ANOVA P < 0.0001. B) Left lung, Mixed-effects ANOVA P < 0.0001. Post-ANOVA Tukey’s comparison P values are shown.

Comparison of mean terminal airway generation by lung. Whiskers represent standard deviation. A) Right lung, Mixed-effects ANOVA P < 0.0001. B) Left lung, Mixed-effects ANOVA P < 0.0001. Post-ANOVA Tukey’s comparison P values are shown.