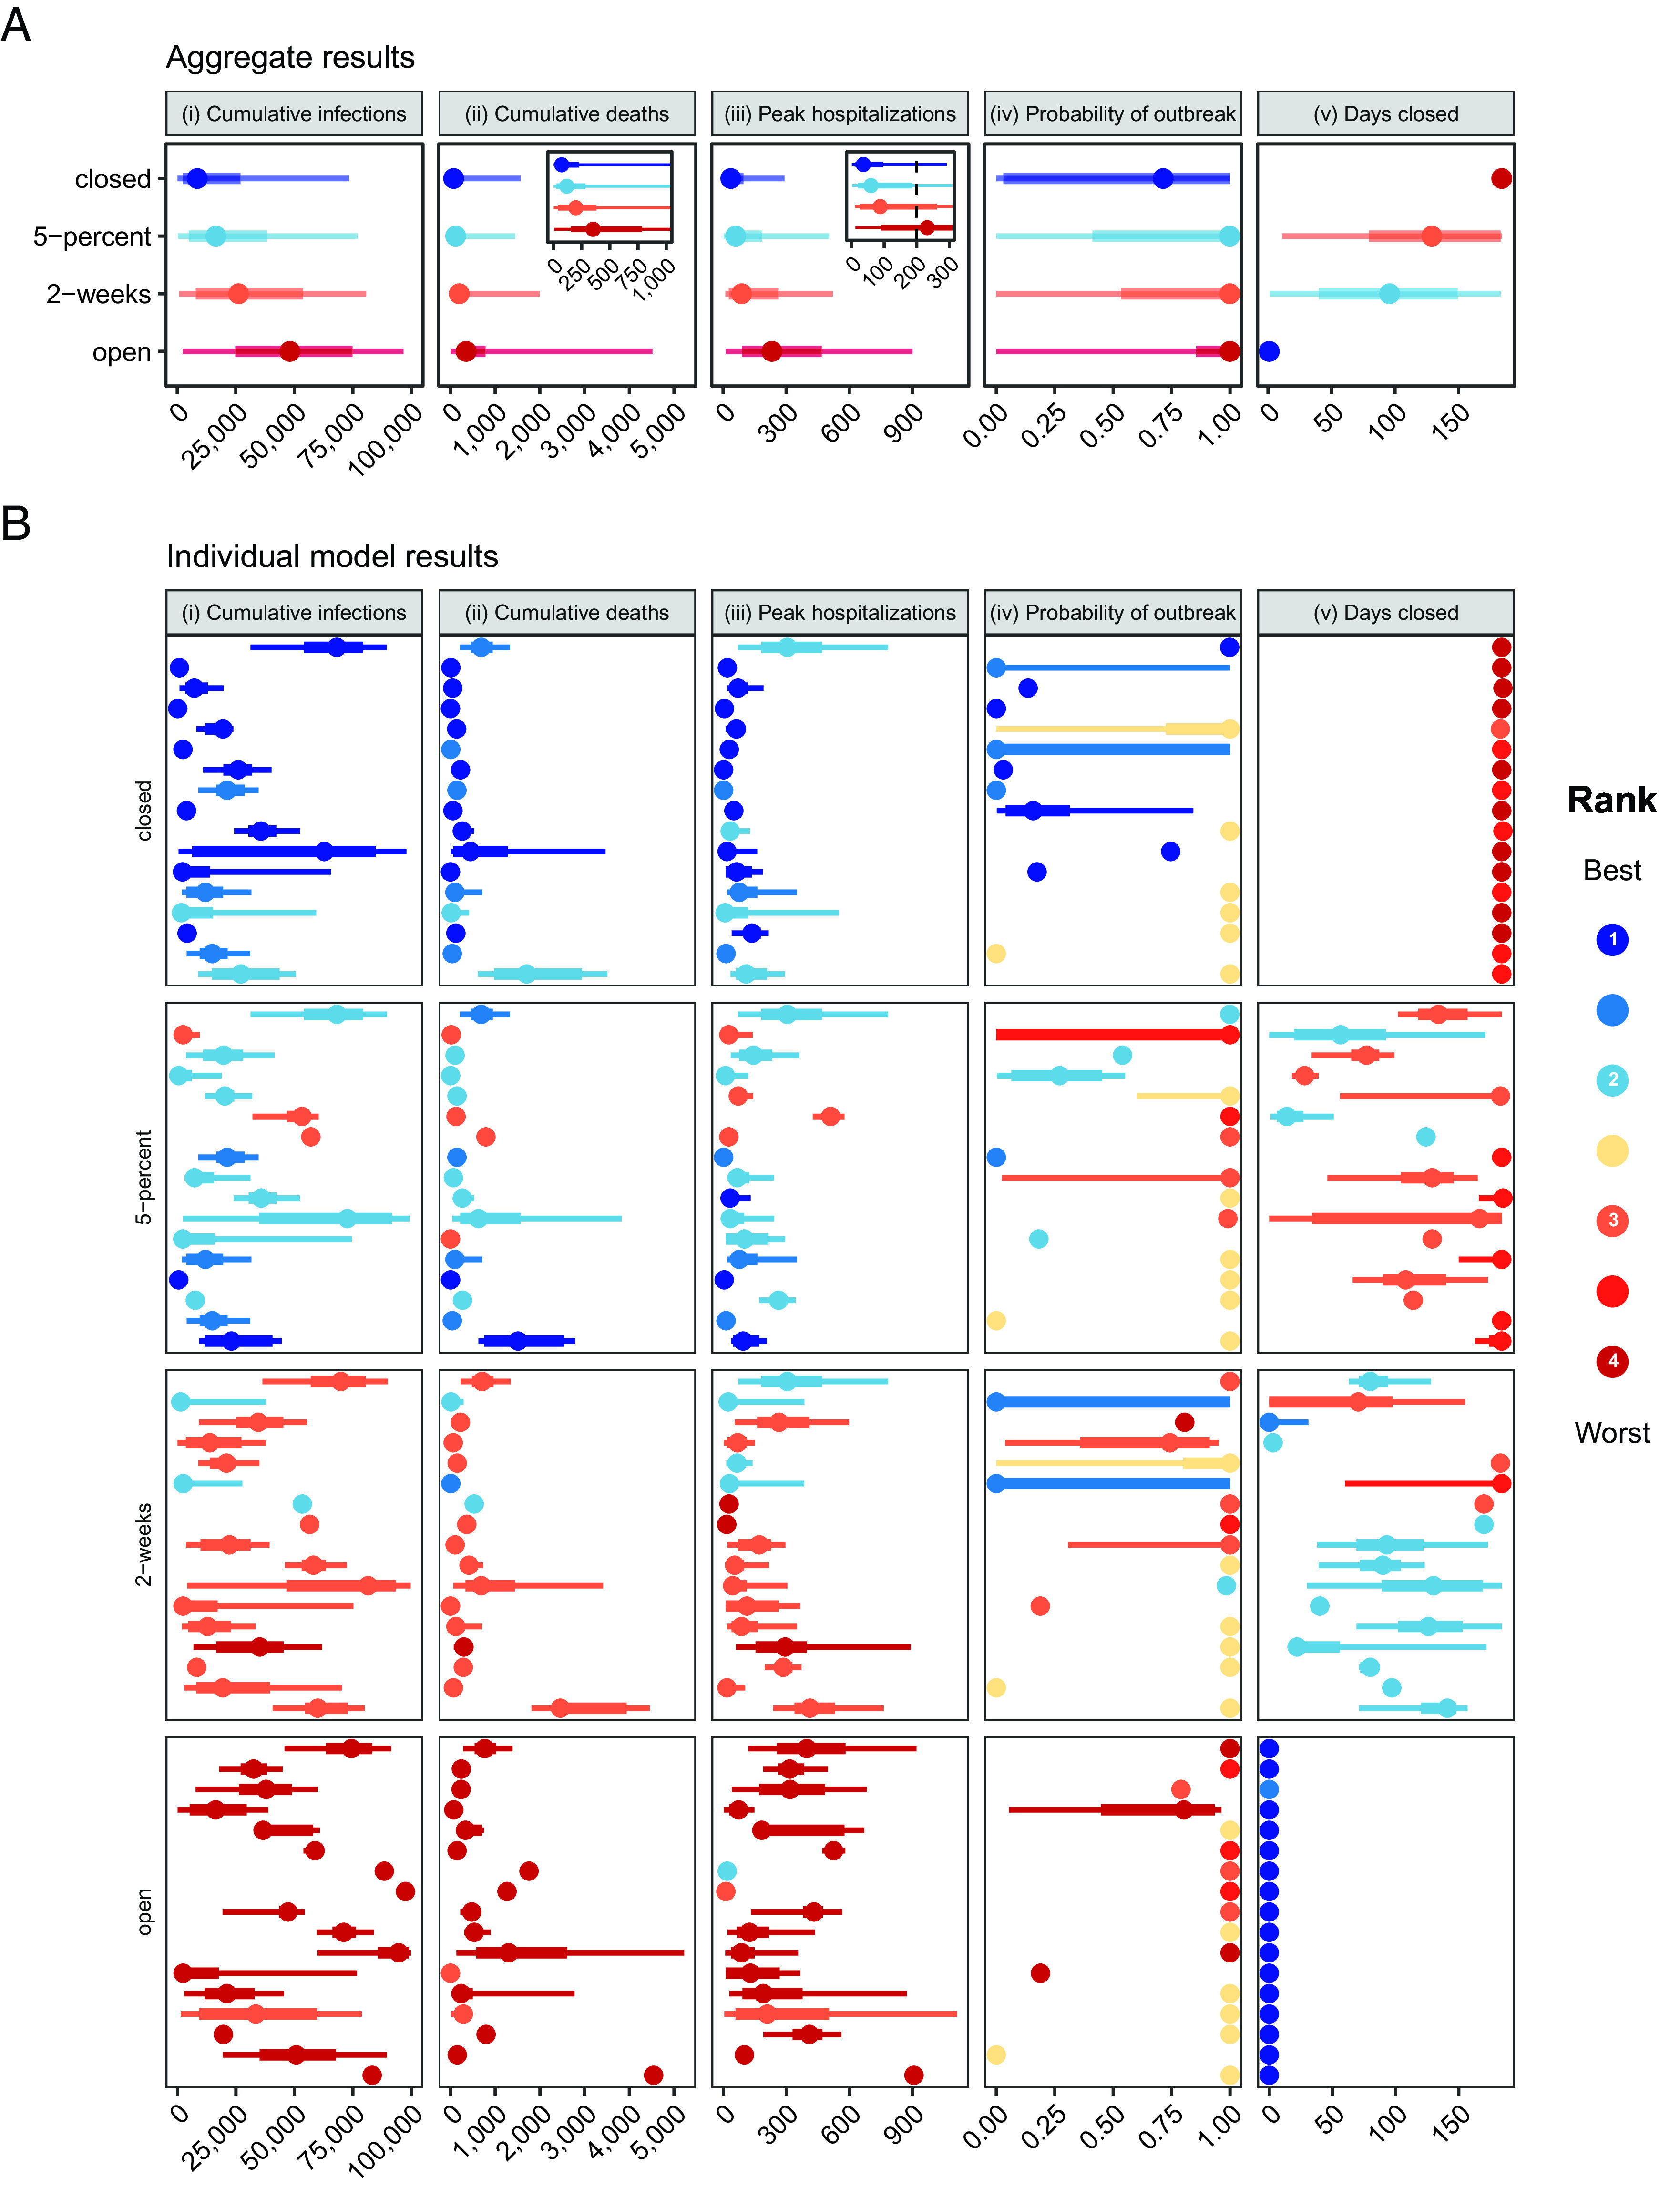
Fig. 1.

Aggregate and 17 individual model results for target objective and intervention scenario pairs. Medians, 50% prediction intervals (PIs, the range of values within which we project future outcomes will fall with 50% probability), and 90% PIs are indicated as points, thick lines, and thin lines, respectively. Colors denote ranking of each intervention for a single objective, where dark blue signifies the lowest value (best performance) and dark red signifies the highest value (worst performance). Ties in ranks are colored as intermediate values. Ties between ranks 1 and 2 and ranks 3 and 4 are shown as an intermediate blue and red, respectively; yellow indicates a tie in ranks across all interventions. The five panels show the results for: i) cumulative SARS-CoV-2 infections (rather than reported cases) between May 15 and November 15, 2020; ii) cumulative deaths due to COVID-19 over the same period, with an inset displaying the results for a smaller range of values, beginning with zero and containing the 50% prediction intervals; iii) the peak number of hospitalizations over the same period, with the inset showing a smaller range of values, and the hospital capacity of 200 beds with a vertical dotted line; iv) the probability of an outbreak of greater than 10 new cases per day after May 15; and v) the number of days that nonessential workplaces are closed between May 15 and November 15. The interventions include “closed”, workplace closure throughout the 6-mo period; “5-percent”, nonessential workplace reopening when cases decline below 5% of the peak caseload; “2-wk”, nonessential workplace reopening 2 wk after the peak; and “open”, immediate reopening of all workplaces on May 15. The setting is a generic US county of 100,000 people that had experienced 180 reported cases and 6 deaths as of May 15, 2020; all schools are assumed to be closed throughout the projection period. (A) Aggregate distributions for each objective and intervention scenario pair. The aggregate distributions were calculated as the unweighted average of the individual cumulative distribution functions across the 16 modeling groups. (B) Individual model results for each objective and intervention scenario pair. Results are presented here essentially as they were shown to modeling teams during the between-round discussion (except each projection was labeled with a letter that was only shared with the team that generated that projection); projections were intentionally presented anonymously to avoid groupthink and authority bias.
