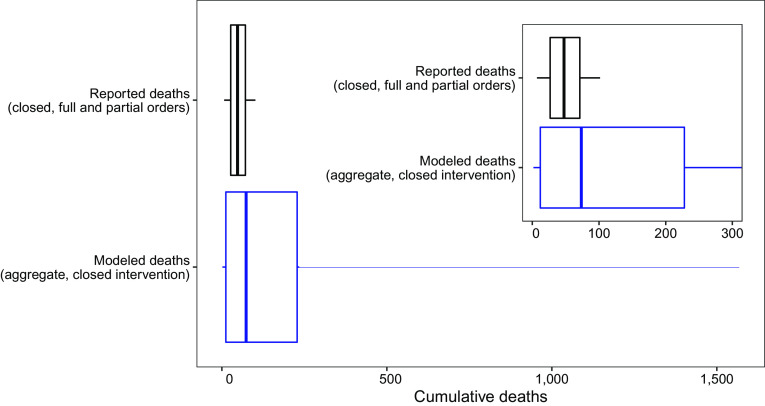
Fig. 3.
Comparison of aggregate reported county death data to modeled deaths for the closed intervention. Boxplot of cumulative reported deaths from 84 US counties with full or partial stay at home orders in place from May 15 to November 15, 2020 (median deaths: 48; 50% IQR: 27, 71) and model results for cumulative deaths from May 15 to November 15, 2020 under the closed intervention (median deaths: 73; 50% IQR: 12, 228). Vertical line shows median value, box shows IQR (25th to 75th quantiles), and whiskers extend to the 5th and 95th quantiles. Inset shows overlap of box area for the plots.

