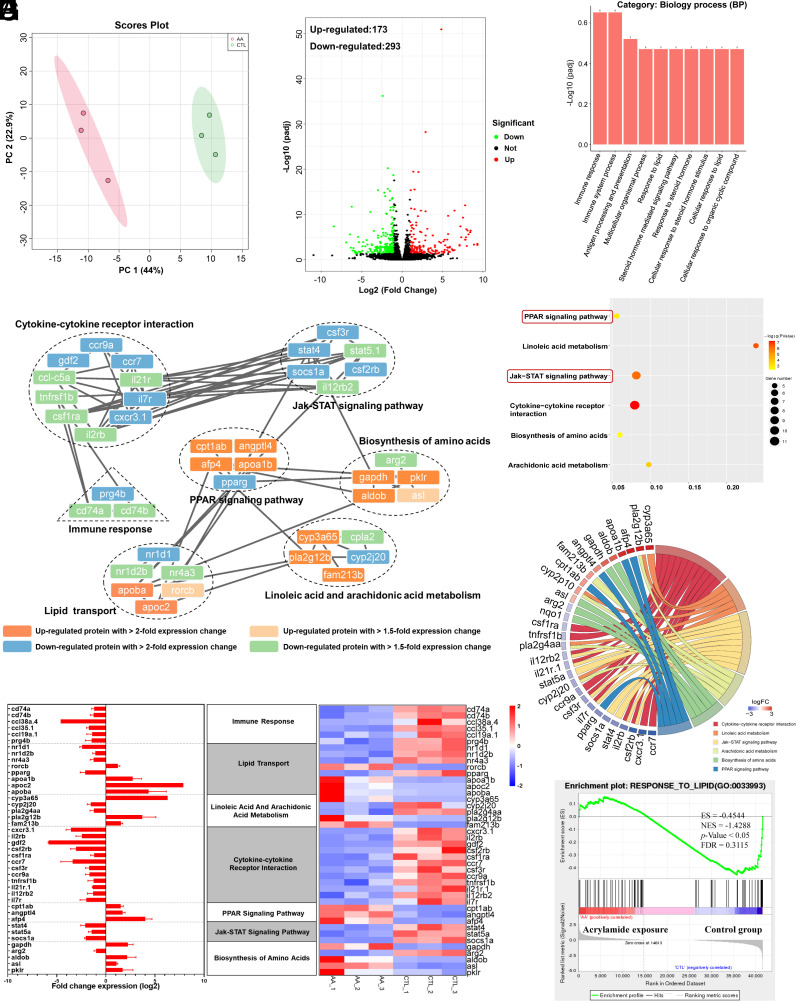
Fig. 4.
Chronic exposure to acrylamide induces lipid perturbation and inflammatory response based on DEGs analysis. (A) The control and acrylamide-treated groups were completely distinguished by different colors in PCA plots. (B) Volcano map based on DEGs [padj < 0.05 and absolute Log2 FC (fold change) ≥ 1]. (C) Enrichment analysis of GO function based on DEGs. (D) Dotplot of the enriched KEGG pathway for DEGs in the brain of zebrafish due to acrylamide exposure. (E) Interaction network of differentially expressed proteins in major pathways with significant changes due to acrylamide exposure. (F) Relationship between DEGs and KEGG pathways. (G) Visual analysis of DEGs in major pathways. A horizontal bar graph of gene expression (Left) and a heat map of gene expression (Right). (H) GSEA results showing response to lipid-related pathways with significant changes in the brain of zebrafish after exposure to acrylamide for 180 d.

