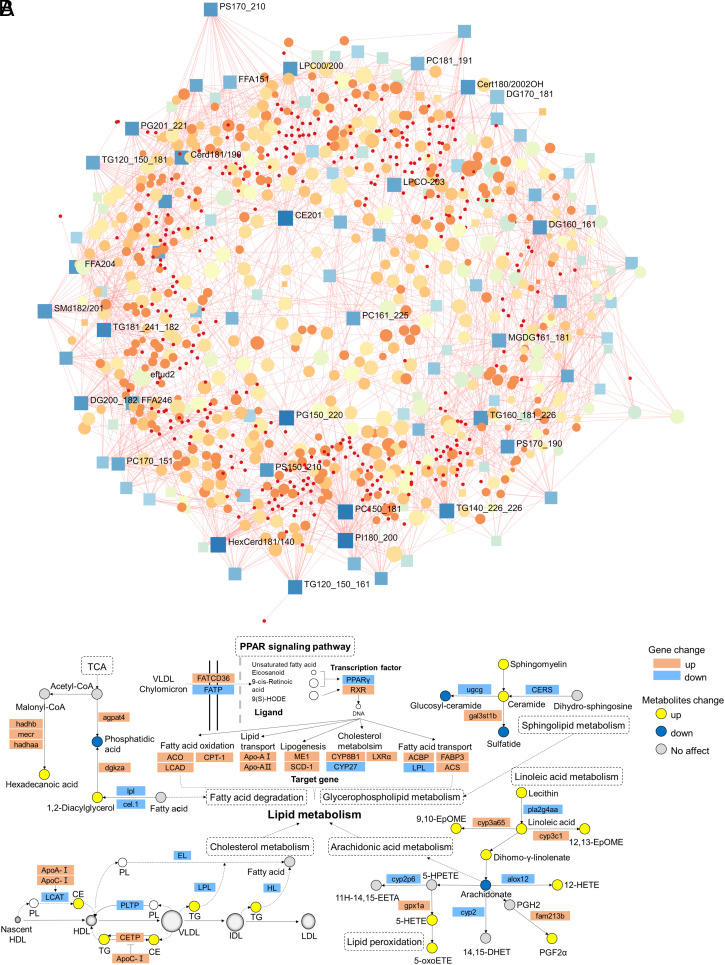
Fig. 5.
Chronic exposure to acrylamide disturbed cholesterol metabolism and arachidonic acid metabolism via the PPAR signaling pathway. (A) Network of the DEGs and lipid metabolites in zebrafish with exposure to acrylamide. Squares represent lipid metabolites and circles represent genes. (B) Key pathways (PPAR signaling pathway, cholesterol metabolism, arachidonic acid metabolism, lipid peroxidation, fatty acid degradation, sphingolipid metabolism, and linoleic acid metabolism) in the integration of transcriptomics and lipidomics. The bars are shown as mean ± SD. Statistical differences were determined using an unpaired Student's t test. AA, the acrylamide-treated (0.5 mM) group; CTL, the control group.

