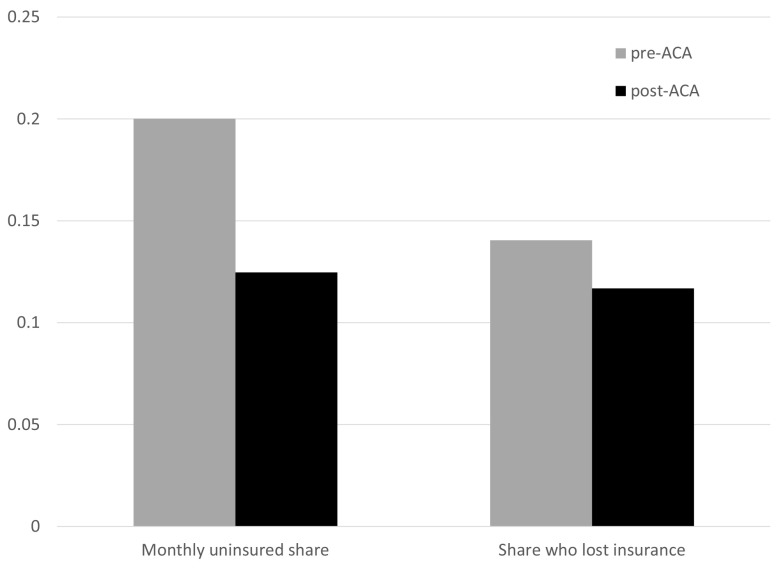
Fig. 2.
Average share uninsured and 2-y risk of insurance loss. Figure displays the average share uninsured in any given month and the 2-y risk of insurance loss, before and after the implementation of the ACA. We measure the risk of insurance loss by restricting the sample to individuals who are insured in the first survey month and then estimate the share of those initially insured individuals who are uninsured at some point over the 2-y survey. Data are drawn from the MEPS. The “pre-ACA” period pools the six 2-y cohorts which begin in the years 2007 through 2012 (N = 78,788). The “post-ACA” period pools the five 2-y cohorts which begin in the years 2014 through 2018 (N = 59,784). We exclude the “partially treated” 2-y cohort which begins in 2013. Longitudinal weights are applied.

