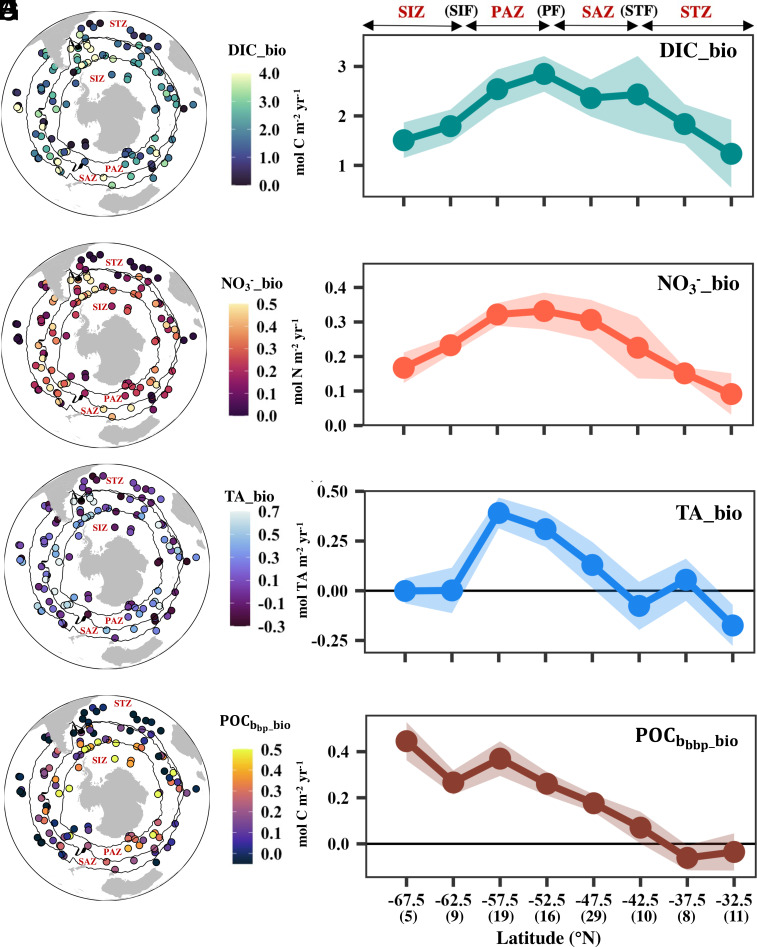
Fig. 1.
Euphotic zone net biological production during the SO productive season. Left panels (A, C, E, G) show the net biological production estimated for each seasonal cycle from various floats (individual circles indicate the mean float location during each productive season). Black lines denote the climatological locations (mean of 2004 to 2014) of SO fronts determined using an argo-based climatology of temperature and salinity (23). Right panels (B, D, F, H) show the meridional pattern of net biological production from each tracer. Numbers in parentheses at the bottom of the right column indicate the number of float seasonal cycles used to compute the average in each zonal band (5° bin). Labels above the right column indicate the approximate locations of frontal regions, with more precise locations found in the left column maps. Shading in the Right panels reflects the propagated error. STF: subtropical front; STZ: subtropical zone; SAZ: subantarctic zone; PF: polar front; PAZ: polar Antarctic zone; SIF: seasonal ice front; SIZ: sea ice zone; bio: biological production term; DIC: dissolved inorganic carbon; NO3: nitrate; TA: total alkalinity; : particulate organic carbon based on the backscattering coefficient.

