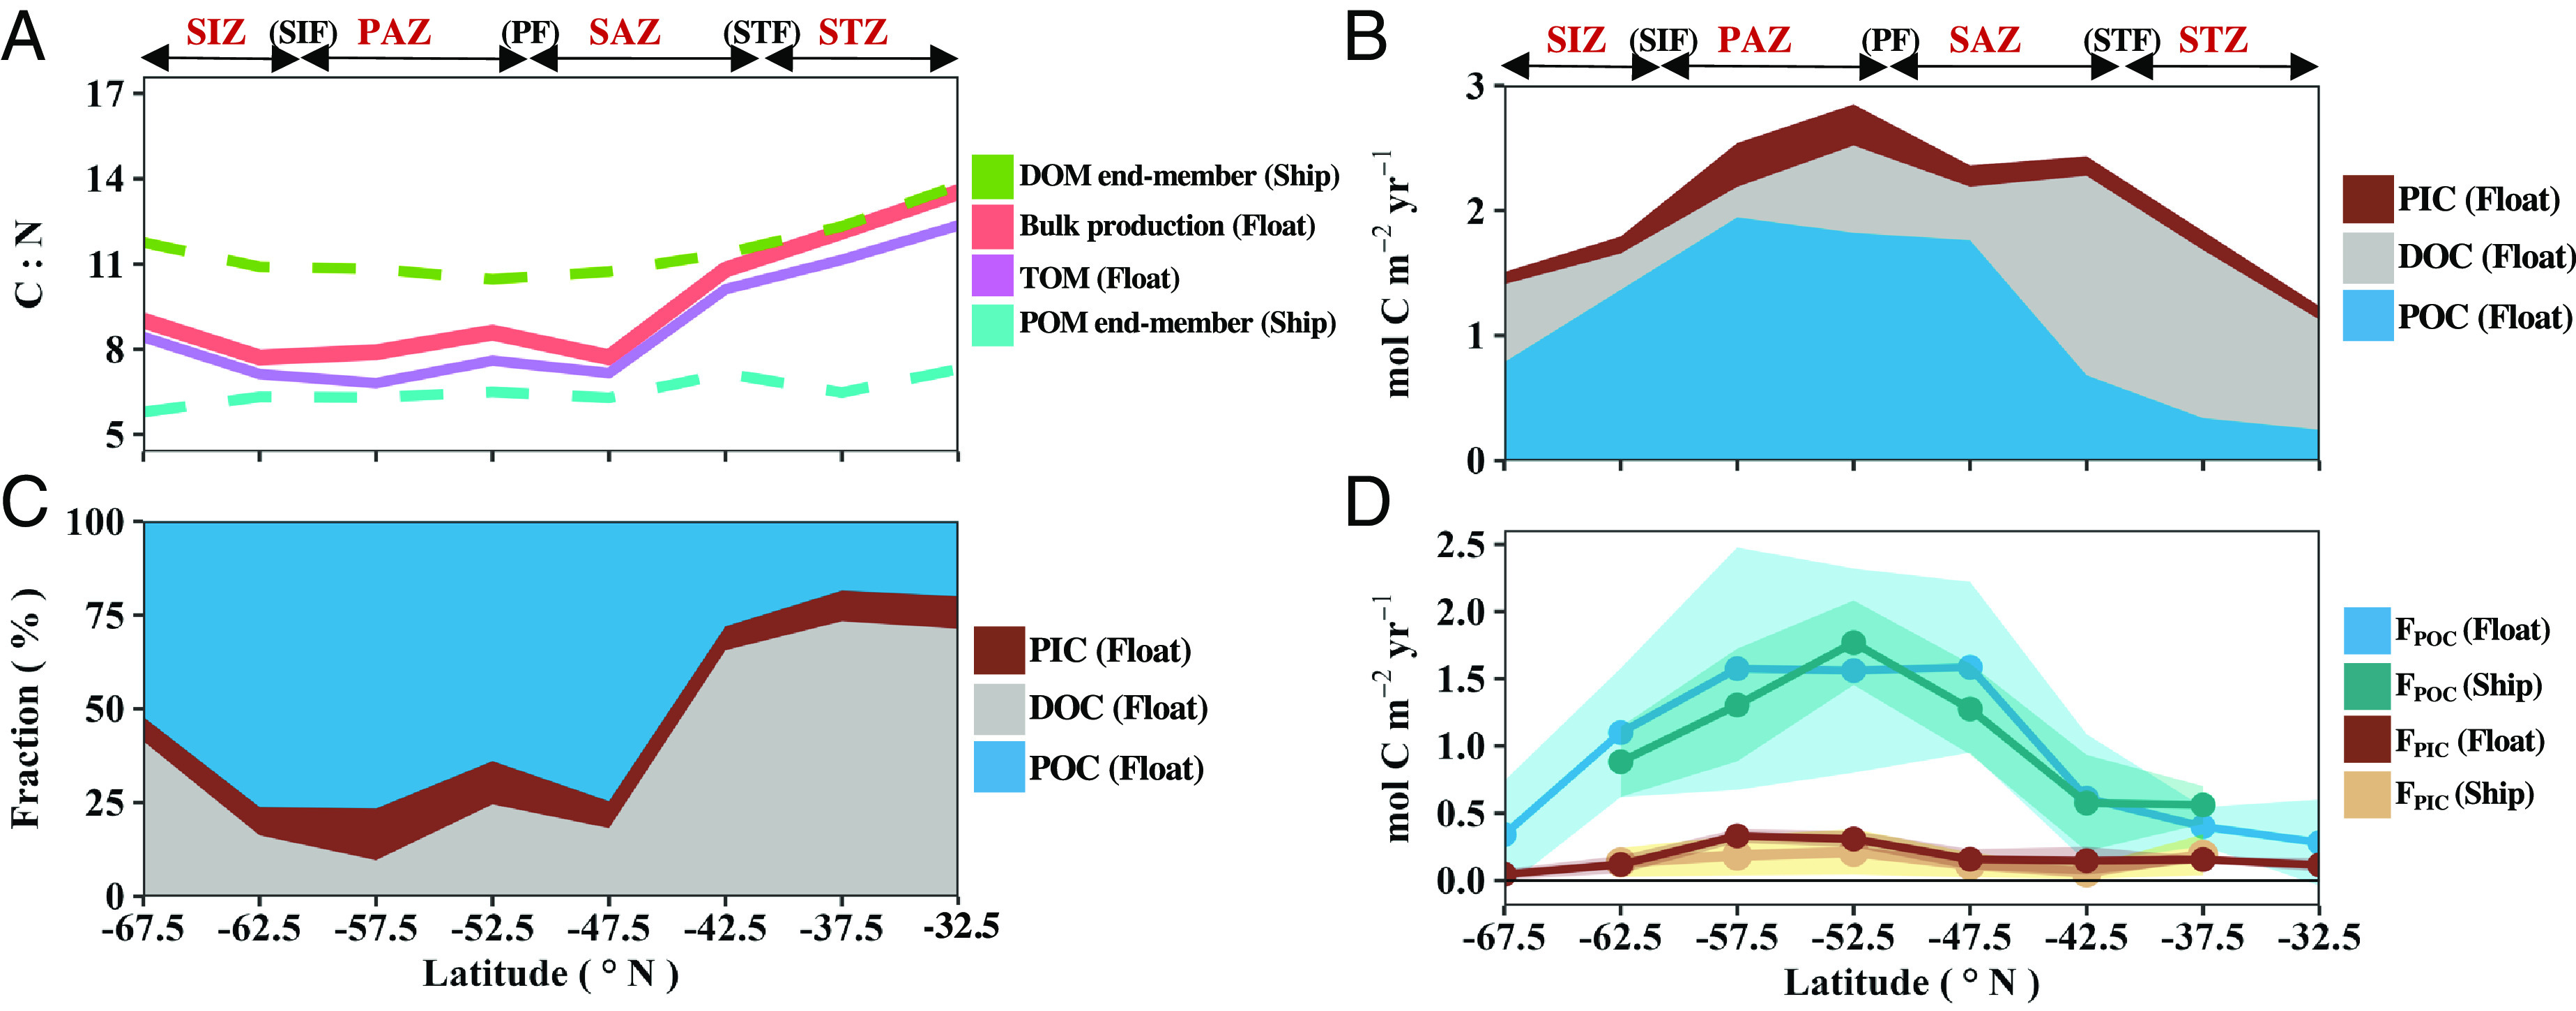
Fig. 2.

Meridional patterns of euphotic zone biogenic carbon pool production during the SO productive season. (A) Carbon-to-nitrogen ratios (C:N) of biological production from the float observations and compilations of existing ship-based datasets (SI Appendix, Text S1.1). (B) Magnitude and (C) fraction of biogenic carbon pool export potential. (D) Sinking flux of particulate organic carbon (FPOC) and particulate inorganic carbon (FPIC) from float and ship-based analyses (SI Appendix, Text S1.2). Shading represents the propagated error. Frontal zones as described in Fig. 1. DOM: dissolved organic matter; POM: particulate organic matter; TOM: total organic matter; PIC: particulate inorganic carbon; DOC: dissolved organic carbon; POC: particulate organic carbon.
