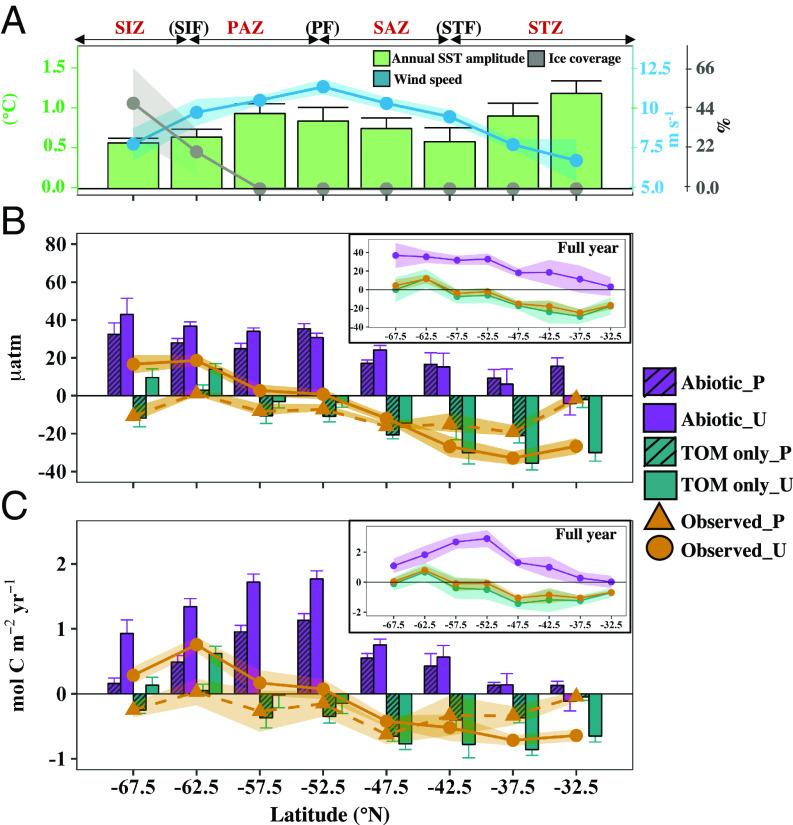
Fig. 3.
Influence of biology on air–sea CO2 exchange in the SO. Meridional pattern of (A) seasonal SST range, annual average wind speed, and percentage sea ice cover; (B) average sea–air pCO2 difference (ΔpCO2 = pCO2 sea − pCO2 air); and (C) cumulative CO2 flux over the productive (P) and unproductive seasons (U) for the different productivity scenarios, with annual results shown in subpanels. The shading and error bars reflect the propagated uncertainty. Frontal zones as described in Fig. 1. Positive values in B and C indicate a source of CO2 to the atmosphere. Abiotic: reconstructed, abiotic ocean; TOM only: reconstructed ocean with only total organic carbon production; Observed: observed, biotic ocean including both TOM and PIC production.

