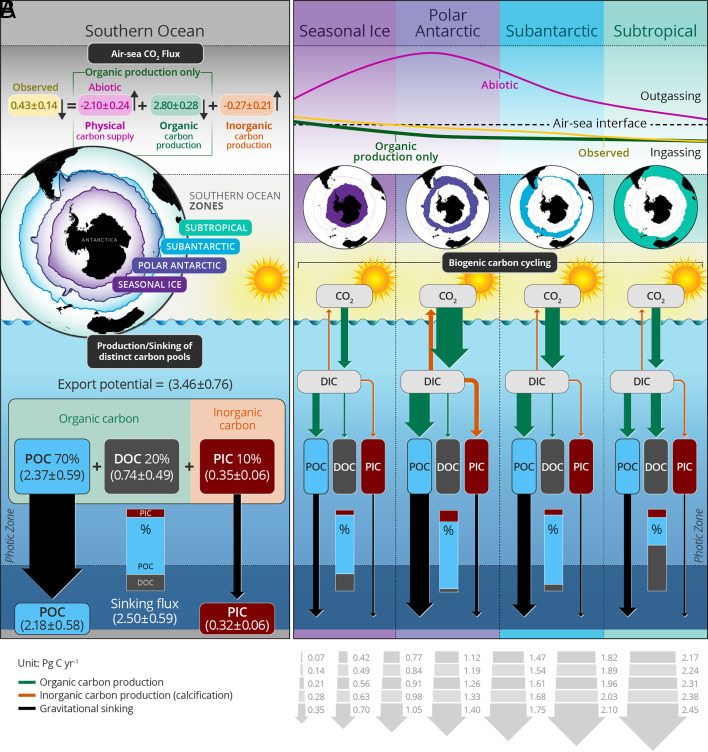
Fig. 4.
(A) Schematic of SO annual carbon cycling with results for the four frontal regions shown in panel B. Contributions of distinct biogenic carbon pools to the total biological carbon production and the associated impacts on air–sea CO2 flux. Arrow sizes are proportional to the area-weighted, cumulative carbon flux magnitude within each frontal zone presented in SI Appendix, Fig. S4. Inset bar plots show the percentage contributions of each biogenic carbon pool to the export potential. Note that the annual biological production estimate is scaled from the float-based productive season estimate (shown in Figs. 1 and 2) based on information extracted from a data-assimilative SO model at each float location (Methods and Materials and SI Appendix, Fig. S9). A similar diagram illustrating results for the productive season only is provided in SI Appendix, Fig. S11.

