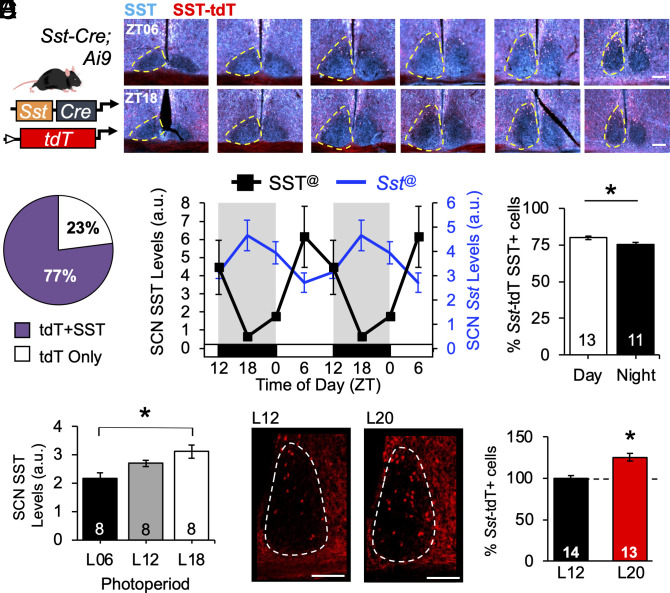
Fig. 1.
Spatiotemporal mapping of Sst SCN subpopulation. (A) Genetic approach for labeling Sst–tdT+ cells, with representative images illustrating Sst–tdT and SST expression at midday (ZT06) and midnight (ZT18). (B) Percent cells expressing Sst–tdT with and without SST. (C) Daily rhythm in SST and Sst expression, double-plotted to facilitate visualization. (D) Day–night difference in SCN expression of Sst–tdT and SST. (E) Photoperiodic modulation of SCN SST expression. (F) Photoperiodic modulation of Sst transcription in the hypothalamus. Representative images illustrating SCN Sst–tdT+ cells. Twelve weeks of L20 entrainment increased the number of SCN Sst–tdT+ cells. Scale bars, 100 μm, ZT = Zeitgeber time, ZT12 = time of lights off, a.u. = arbitrary units. @Circwave test of rhythmicity, P < 0.05. *post hoc comparisons, P < 0.05.

