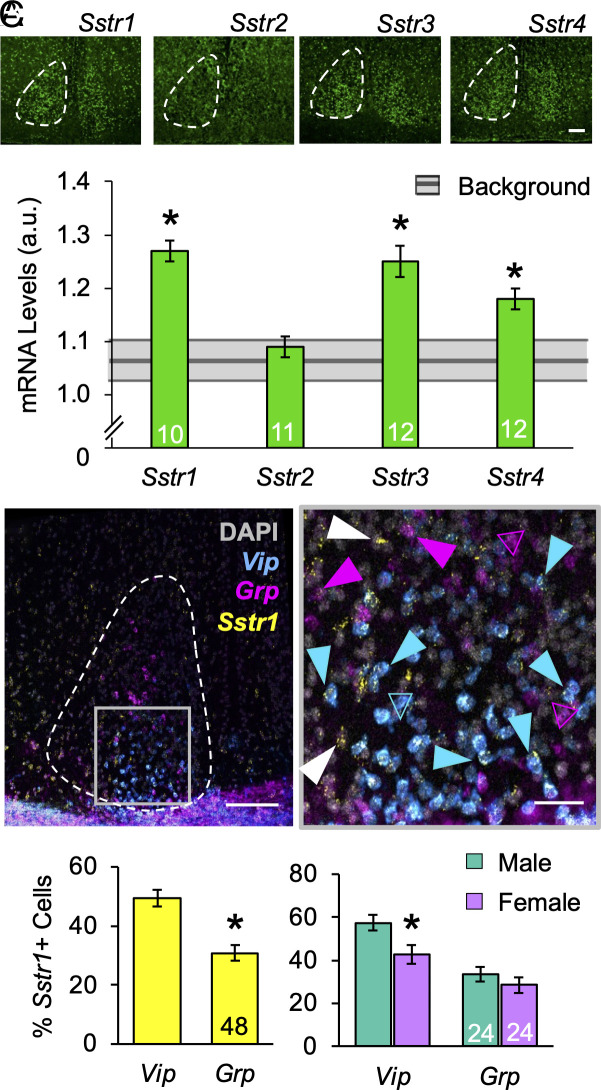
Fig. 5.
SCN expression of SSTR. (A) Representative images of Sstr1-4 expression and levels in the SCN. Gray bar indicates background levels for each probe ± the 95% (CI). (B) Representative image illustrating SCN transcription of Vip, Grp, and Sstr1 at ZT18. At higher magnification, Vip/Grp cells with and without Sstr1 coexpression are indicated by closed and open arrows, respectively. (C) Number of Sstr1-expressing Vip and Grp SCN neurons. Scale bar, 100 μm, Higher-magnification Scale bar, 25 μm *post hoc comparisons, P < 0.05.

