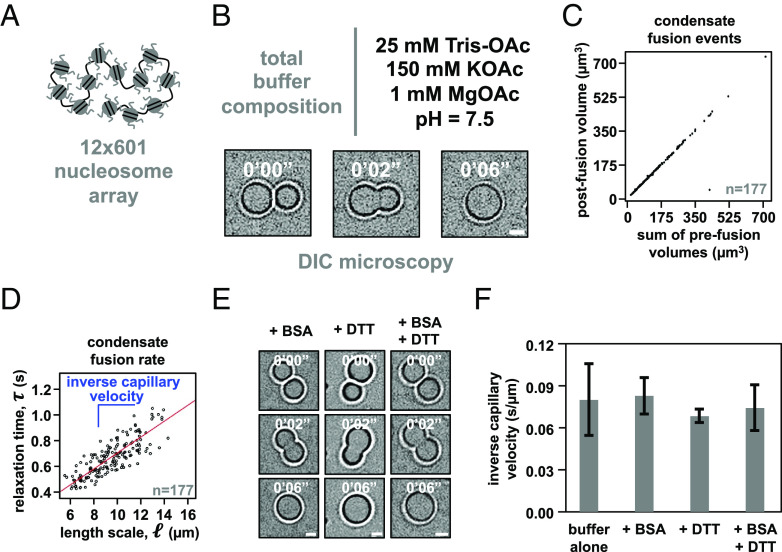
Fig. 1.
Intrinsic chromatin condensates are fluid without BSA and DTT. (A) Graphical depiction of the dodecameric nucleosomal arrays used for experimentation. (B) Differential interference contrast microscopy images of a fusion event between intrinsic chromatin condensates in the indicated buffer. (C) Dot plot representation of the inferred total volume of condensates before and after fusion. (D) Relaxation time versus length scale (sum of prefusion diameters) for 177 individual instances of condensate fusion in the buffer composition indicated in Fig. 1B. Inverse capillary velocity, the characteristic ratio of surface tension, , and viscoscity, , is derived from the linear fit (red line) of the plots’ slope. (E) Differential interference contrast microscopy images of intrinsic chromatin condensate fusion in the buffer indicated in Fig. 1B supplemented with BSA (0.1 mg/mL, Left), DTT (5 mM, Middle), or BSA and DTT (0.1 mg/mL and 5 mM, respectively, Right). (F) Bar chart of inverse capillary velocities ( SD of 2 biological replicates) of intrinsic chromatin condensates in the buffer indicated in Fig. 1B, buffer with BSA, or buffer with BSA and DTT. For each condition, the fusion events per replicate are: buffer (177 and 68), +BSA (147 and 81), +DTT (183 and 68), +BSA+DTT (184 and 93). Scale bars, in white, are 4 μm.

