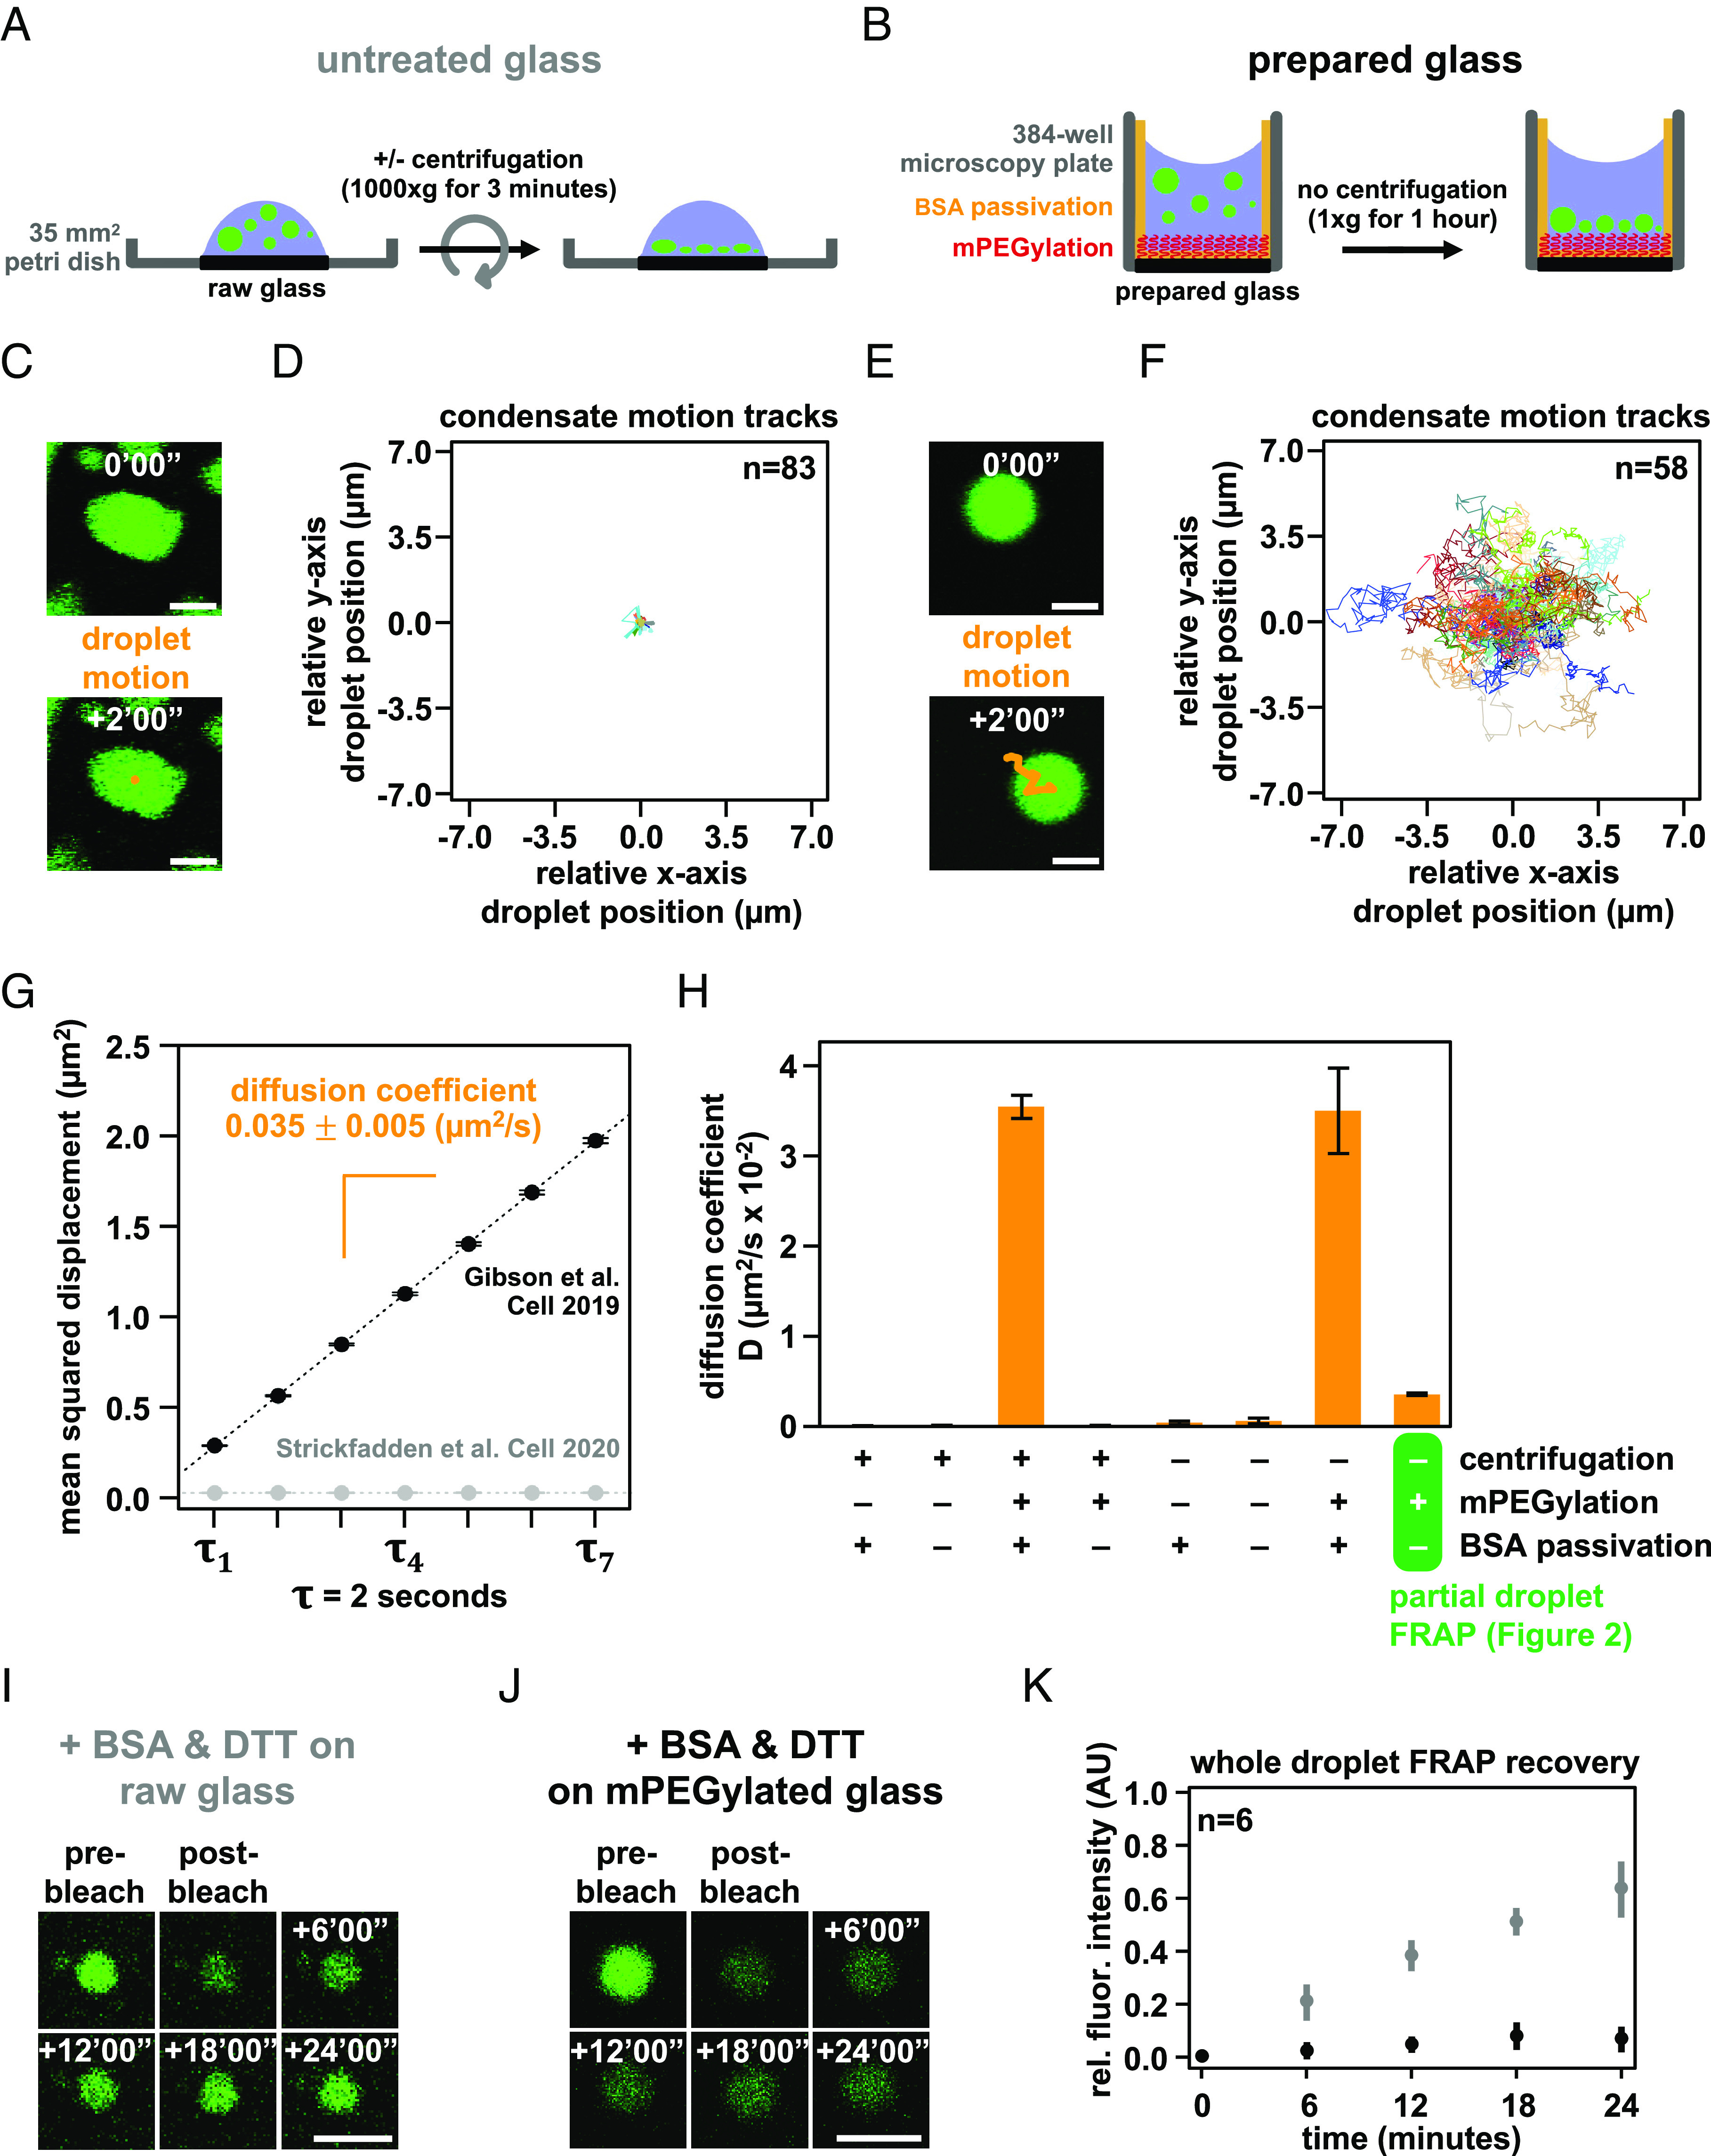
Fig. 4.

Condensate movement and dynamics is affected by microscopy glass preparation. Graphical depiction of techniques used to prepare intrinsic chromatin condensates for fluorescence microscopy imaging: (A) Intrinsic chromatin condensates can be spun onto raw glass using a centrifuge (27). (B) Alternatively, intrinsic chromatin condensates can be added to a 384-well microscopy plate and brought by gravity to rest on mPEGylated and BSA-passivated glass (11). Movement of a single or many intrinsic chromatin condensates, following their preparation for fluorescence microscopy imaging on untreated glass (C and D) and prepared glass (E and F). (C and E) The movement of an individual condensate across 2 min in 10 s intervals is overlaid in orange on fluorescence microscopy images of AlexaFluor 488-labeled intrinsic chromatin condensates, in green. (D and F) The relative movement of many condensates determined across 2 min in 500 ms intervals. (G) Plot of mean squared displacement ( SE) over lag time, , for intrinsic chromatin condensates between 4 and 8 μm in diameter following centrifugation onto untreated glass (gray dots) or settling by gravity onto prepared glass (black dots). The diffusion coefficient, indicated in orange SE, of intrinsic chromatin condensates can be calculated from the slope of the linear fit (dashed line) of the plotted data. For droplets centrifuged onto untreated glass, three replicates with 11,222, 8,114, and 14,092 trajectories extracted from 171, 147, and 238 droplets were used for analysis, respectively. For droplets settled onto passivated glass, three replicates with 6,563, 7,900, and 8,179 trajectories extracted from 106, 100, and 101 droplets were used for analysis, respectively. (H) Bar chart of the diffusion coefficients of intrinsic chromatin condensates following their preparation for microscopy with and without centrifugation, mPEGylation of the microscopy glass, and BSA passivation of the microscopy well. Error bars are SD of four technical replicates. Confocal fluorescence microscopy of whole-droplet FRAP of intrinsic chromatin condensates composed of AlexaFluor 488-labeled long linker-length nucleosomal arrays, in green, settled onto (I) untreated or (J) mPEGylated glass. (K) Quantification of whole-droplet FRAP recovery of intrinsic chromatin condensates on raw or mPEGylated glass, in gray and black, respectively. Fluorescence signal is normalized to pre-bleach droplet intensity and error bars are SD of six technical replicates. Panels C–H used nucleosome arrays with a 25 base pair internucleosome linker length. Panels I–K used nucleosome arrays with a 60 base pair internucleosome linker length. Scale bars, in white, are 4 μm.
