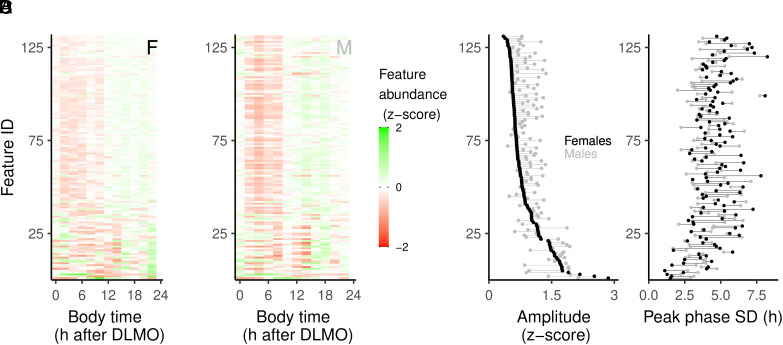
Fig. 1.
Overview of metabolite rhythms. (A) Normalized abundance over time for female data, ordered by amplitude. (B) Normalized abundance over time for male data, using the same ordering as for the female data. Rhythmic amplitude (C) and peak phase SD (D) are plotted for female (black) and male (gray) data and connected with a line for each metabolite. For each metabolite, a line to the right of a black dot indicates a higher amplitude (C) or phase SD (D) in males, lines to the left indicate a higher amplitude (C) or phase SD for females (D).

