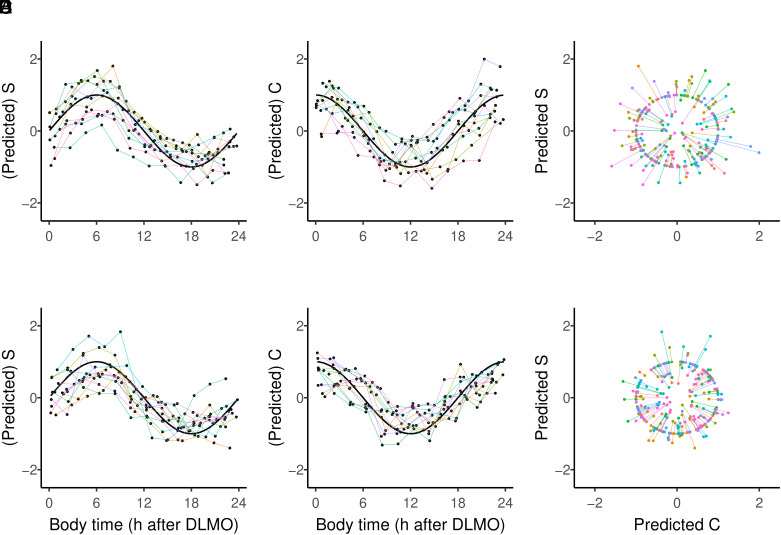
Fig. 2.
Model fitting and predictions. Overview of (predicted) S and C coordinates for female data (A and B) and male data (D and E), together with the actual S and C coordinates of measured body time projected on a unit circle for females (C) and males (F). Predictions of n models are color-coded and connected for each left-out participant/model prediction. Black curves (A, B, D, and E) show the sine or cosine function for sample time in hours after DLMO, and each participant is represented by a single color line.

