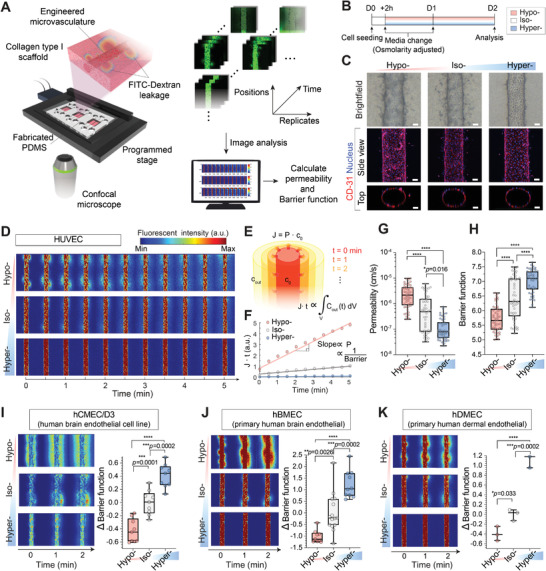
Figure 1.

Continuous hyperosmolarity exposure enhances the vascular barrier function in human microvasculature‐on‐chips. A) Human microvessel engineering and barrier function assay platform. Endothelial cells are cultured onto a cylindrical collagen scaffold. The barrier functions of engineered microvessels are then quantified by time‐course imaging of fluorescein isothiocyanate (FITC)‐dextran leakage out from the vessel lumen. B) Experimental timeline for testing the effect of osmotic exposure on microvessel barrier function. Otherwise noted, all images and data represent microvessels 2 d after osmolarity adjustments (D2). C) Representative bright‐field images (top) and immunostaining of CD31 images (bottom; side and top view) of osmolarity (hypo‐, iso‐, or hyperosmolarity) adapted human umbilical vein endothelial cell (HUVEC) 3D engineered microvessels. Cell nuclei were counterstained with DAPI. For iso‐osmotic conditions, microvessels are cultured in regular endothelial culture media. Note that cylindrical lumen (hollow channel) is created inside the vessels. Scale bars, 50 µm. D) Representative fluorescent images of 4 kDa FITC‐dextran leakage from osmolarity‐adapted HUVEC engineered microvessels. Three images along the vessel's vertical positions were acquired per each microvessel. t = 0 min images were taken immediately after the lumen was filled with 4 kDa FITC dextran. E,F) Schematic and representative dextran flux graph as a function of time from osmolarity‐adapted HUVEC 3D engineered microvessels. Permeability (and 1/Barrier function; values > 0) is quantified from the slope of the J∙t versus t graph. G,H) Permeability and barrier function of osmolarity‐adapted HUVEC 3D engineered microvessels at D2 (n = 48, 50, and 47 engineered microvessels for hypo‐, iso‐, and hyperosmotic conditions, respectively). I–K) Representative fluorescent images of 4 kDa FITC‐dextran leakage (left) and barrier function (right) of osmolarity‐adapted hCMEC/D3, hBMEC, and hDMEC 3D engineered microvessels (hCMEC/D3: n = 9, 9, and 9; hBMEC: n = 9, 15, and 10; hDMEC: n = 3, 3, and 3, for hypo‐, iso‐ and hyper‐, respectively). Box and whisker plots in panel (G)–(K) represent median value (horizontal bars), 25–75 percentiles (box edges), and minimum to maximum values (whiskers). P‐values were obtained using one‐way ANOVA followed by Tukey's HSD post hoc test. n.s.: not significant, ****P < 0.0001.
