Figure 3.

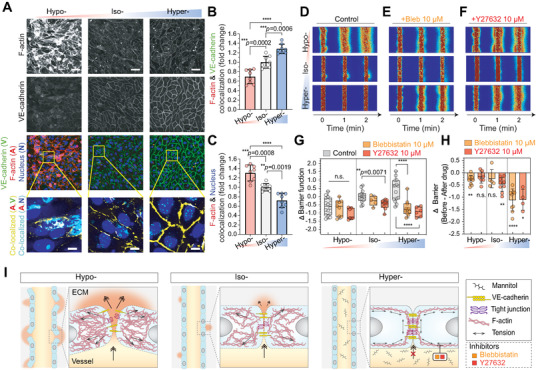
Cell–cell junction localization of F‐actin and actomyosin‐dependent barrier function imply mechanobiological adaptation of microvessels during osmolarity exposure. A) Representative immunostaining of F‐actin and VE‐Cadherin in HUVEC 2.5D monolayer 2 d after corresponding osmotic adjustment (hypo‐, iso‐, or hyperosmotic condition at D2; see Figure 1B for detailed timelines). Scale bars, 50 µm. Cell nuclei were counterstained with DAPI. Inset: zoom‐in view of F‐actin and VE‐cadherin (yellow) and actin and nucleus (cyan) colocalized pixels. Cell nuclei were counterstained with DAPI. Scale bars, 10 µm. B,C) Fraction of F‐Actin & VE‐cadherin and F‐Actin & Nucleus colocalized pixels from the immunostained images. Mean ± S.D. n = 8 images from five biological replicates. See Figure S15 (Supporting Information) for detailed processing steps. D–F) Representative fluorescent images of 4 kDa FITC‐dextran leakage from osmolarity‐adapted HUVEC 3D engineered microvessels without treatment, 30 min after 10 × 10−6 m Blebbistatin, and 10 × 10−6 m Y‐27632 treatment. t = 0 min images were taken immediately after the lumen was filled with FITC‐dextran solutions. G,H) Barrier function changes, relative to iso‐osmotic controls or before drug treatments, in osmolarity‐adapted HUVEC 3D engineered microvessels 30 min after 10 × 10−6 m Blebbistatin and 10 × 10−6 m Y‐27632 treatment (Control: n = 16, 14, and 13 microvessels for hypo‐, iso‐, and hyper‐, respectively; Blebbistatin: n = 9, 5, and 9 microvessels for hypo‐, iso‐, and hyper‐, respectively; Y‐27632: n = 7, 9, and 4 microvessels for hypo‐, iso‐, and hyper‐osmotic conditions, respectively). In panel (G), box and whisker plots represent median value (horizontal bars), 25–75 percentiles (box edges), and minimum to maximum values (whiskers). In panel (H), data represent Mean ± S.D. I) Proposed mechanism of osmolarity‐driven actin cytoskeletal change and its consequent effect on the vascular barrier function. For panels (B), (C), and (G), P‐values were obtained using one‐way ANOVA followed by Tukey's HSD post hoc test. In panel (H), P‐values obtained by two‐tailed, one‐sample t‐test compared to 0 (P‐values from left to right: 0.0013, 0.086, 0.22, 0.0012, <0.0001, 0.013). n.s: not significant, *P < 0.05, **P < 0.01, ***P < 0.001, ****P < 0.0001.
