Figure 4.

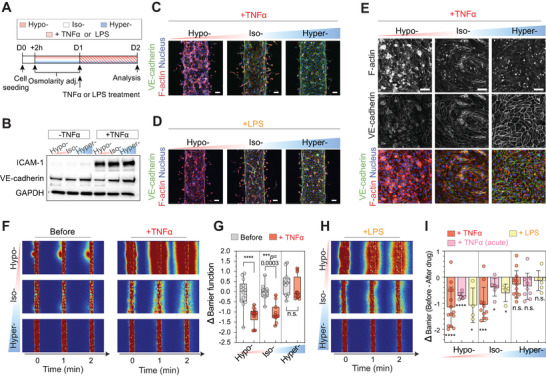
Hyperosmolarity‐adapted microvessels display significantly improved barrier protection under acute and chronic inflammation. A) Experimental timeline for testing the barrier protective effect of osmolarity‐adapted HUVEC 3D engineered microvessels following tumor necrosis factor alpha (TNFα) or lipopolysaccharides (LPS) induced vascular inflammations. Note that osmolarity was persistently maintained during inflammation. B) Western blot displaying ICAM‐1 (an inflammatory marker), and VE‐cadherin levels of osmolarity‐adapted (hypo‐, iso‐, or hyperosmotic) 2.5D HUVEC monolayers 24 h after 0 or 5 ng mL−1 TNFα treatment. GAPDH was used as a loading control. C–E) Representative immunostaining of VE‐cadherin and F‐actin in osmolarity‐adapted HUVEC 3D engineered microvessels 24 h after 5 ng mL−1 TNFα, 24 h after 100 ng mL−1 LPS treatment, and HUVEC 2.5D monolayer 24 h after 5 ng mL−1 TNFα treatment. Cell nuclei were counterstained with DAPI. Scale bars, 50 µm. F) Representative fluorescent images of 4 kDa FITC‐dextran leakage from osmolarity adjusted HUVEC 3D engineered microvessels before (left) and 24 h after 5 ng mL−1 TNFα (right) treatment. t = 0 min images were taken immediately after the lumen was filled with 4 kDa FITC dextran. G) Barrier function before and 24 h after 5 ng mL−1 TNFα treated microvessels with corresponding osmolarity adjustment. Data reflect change relative to iso‐osmotic conditions, before TNFα treatment. n = 14, 11, and 12 microvessels for hypo‐, iso‐, and hyperosmolarity, respectively. Box and whisker plots in panel (G) represent median value (horizontal bars), 25–75 percentiles (box edges), and minimum to maximum values (whiskers). P‐values were obtained using one‐way ANOVA followed by Tukey's HSD post hoc test. H) Representative fluorescent images of 4 kDa FITC‐dextran leakage from osmolarity‐adapted HUVEC 3D engineered microvessels 24 h after 100 ng mL−1 LPS treatment. t = 0 min images were taken immediately after the lumen was filled with 4 kDa FITC dextran. I) Barrier function changes of osmolarity‐adapted HUVEC 3D engineered microvessels 24 h after 5 ng mL−1 TNFα (n = 14, 11, and 12 microvessels for hypo‐, iso‐, and hyperosmotic conditions, respectively), 24 h after 100 ng mL−1 LPS (n = 4, 4, and 6 microvessels for hypo‐, iso‐, and hyperosmotic conditions, respectively), and 4 h after 100 ng mL−1 TNFα (acute; n = 6, 6, and 9 microvessels for hypo‐, iso‐, and hyperosmotic conditions, respectively). Data represent mean ± S.D. P‐values obtained by two‐tailed, one‐sample t‐test compared to 0 (P‐values from left to right: <0.0001, <0.0001, 0.0471, 0.0003, 0.037, 0.036, 0.092, 0.073, 0.42). For panels (G) and (I), n.s: not significant, *P < 0.05, **P < 0.01, ***P < 0.001, ****P < 0.0001.
