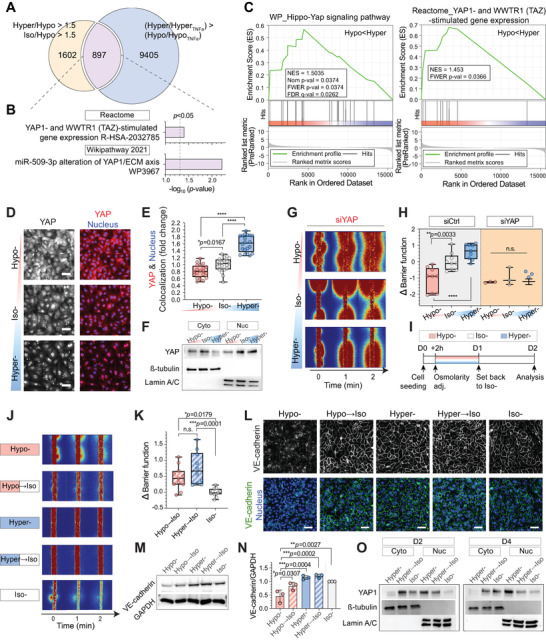
Figure 5.

Hyperosmolarity‐induced Yes‐associated protein (YAP) nuclear localization and enhanced barrier integrity are sustained after iso‐osmotic recovery. A) Number of genes that are upregulated by more than 1.5‐folds in hyper‐ and iso‐ compared to hypo‐ (Hyper/Hypo > 1.5 and Iso/Hypo > 1.5) and that are highly maintained after TNFα treatment in hyper‐, but not in hypo‐osmotic conditions (Hyper/HyperTNFα > Hypo/HypoTNFα ). B) Gene ontology (GO) analysis for the 897 intersected genes from “Reactome” and “Wikipathway 2021.” The dashed vertical lines indicate significance at p < 0.05. C) Gene set enrichment analysis (GSEA) results showing significant enrichment of the gene sets, “Hippo‐Yap signaling pathway” in WikiPathways (WP) and “YAP1‐ and WWTR1 (TAZ)‐stimulated gene expression” in Reactome from the Molecular Signatures Database (MSigDB) in hyper‐ compared to hypo‐osmotic conditions. Red and blue shading indicate high and low log2‐ranked values comparing Hyper/Hypo. NES; normalized enrichment score, Nom p‐value; nominal p‐value, FWER; familywise‐error rate, FDR; false discovery rate. D) Representative immunostaining of YAP in HUVEC 2.5D monolayers 1 d after corresponding osmotic adjustment (hypo‐, iso‐, or hyperosmotic condition at D1; see Figure 1B for detailed timelines). Cell nuclei were counterstained with DAPI. Scale bars: 50 µm. E) Quantification of YAP and DAPI colocalization. n = 20 images from two independent experiments. F) Expression of cytoplasmic and nucleus YAP proteins in HUVEC 2.5D monolayers after osmolarity adaptation. ß‐tubulin and Lamin A/C were used as a loading control for cytoplasmic and nuclear proteins, respectively. G) Representative fluorescent images of 4 kDa FITC‐dextran leakage from osmolarity‐adapted HUVEC 3D engineered microvessels after siYAP treatment. Cells in culture were treated with siYAP 2 d before cell seeding. See Figure S13 (Supporting Information) for detailed timelines. H) Barrier function changes, relative to siCtrl iso‐osmotic conditions, in osmolarity‐adapted siCtrl (left; same as Figure 2G–K) and siCDH5 (right) treated HUVEC 3D engineered microvessels after osmolarity adaptation. I) Experimental timeline for testing the barrier function change of osmolarity‐adapted HUVEC 3D engineered microvessels following iso‐osmotic recovery (i.e., Hypo → Iso, Hyper → Iso). J) Representative fluorescent images of 4 kDa FITC‐dextran leakage from osmolarity‐adapted and iso‐osmotic recovered HUVEC 3D engineered microvessels. t = 0 min images were taken immediately after the lumen was filled with 4 kDa FITC‐dextran. K) Barrier function changes of osmolarity‐adapted HUVEC 3D engineered microvessels following iso‐osmotic recovery (i.e., Hypo → Iso, Hyper → Iso). Data reflect change relative to iso‐osmotic conditions at D2 (Iso‐). L) Representative immunostaining of VE‐cadherin in osmolarity‐adapted and iso‐osmotic recovered HUVEC 2.5D monolayers. Cell nuclei were counterstained with DAPI. Scale bars: 50 µm. M,N) Western blot images of total VE‐cadherin and quantifications of VE‐cadherin compared to GAPDH in osmolarity‐adapted and iso‐osmotic recovered HUVEC 2.5D monolayers. GAPDH was used as a loading control. Data represent mean ± S.D. n = 3 biological replicates. O) Expression of cytoplasmic and nuclear YAP in osmolarity‐adapted and iso‐osmotic recovered HUVEC 2.5D monolayers at D2 (left) and D4 (right). Note that nuclear YAP increase observed in hyper → iso samples at D2 finally recovers at D4. ß‐tubulin and Lamin A/C were used as a loading control for cytoplasmic and nuclear proteins, respectively. For panels (E), (H), and (K) box and whisker plots represent median value (horizontal bars), 25–75 percentiles (box edges), and minimum to maximum values (whiskers). For panels (E), (H), (K), and (N) P‐values were obtained using one‐way ANOVA followed by Tukey's HSD post hoc test. n.s: not significant, ****P < 0.0001.
