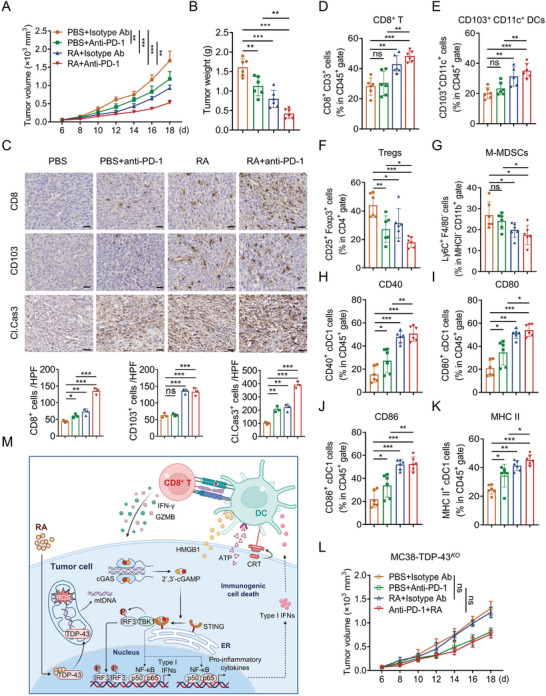
Figure 7.

RA induces immune cell infiltration and potentiates efficacy of anti‐PD1 therapy. C57BL/6 mice bearing MC38 tumor were treated with PBS, anti‐PD‐L1 (100 µg per mouse), RA (4 mg kg−1), or the combination. A) Tumor volume and B) tumor weight were monitored. C) Representative IHC staining results for CD8, CD103, and cleaved caspase 3 in PBS, anti‐PD‐L1, RA, or the combination‐treated mice (Scale bar, 50 µm). Quantification of IHC staining is shown. FACS analyzing the populations of D) CD8+ T cells, E) cDC1, F) Tregs, G) M‐MDSCs, and surface expressions of H) CD40, I) CD80, J) CD86, and K) MHC‐II in cDC1 from PBS, anti‐PD‐1, RA, or the combination‐treated MC38 tumor. n = 6 mice per group. L) Tumor growth of TDP‐43KO MC38 from PBS, anti‐PD1, RA, or the combination treated C57BL/6 mice (n = 6). n = 6 mice per group. Data are presented as mean ± SD, * p < 0.05; ** p < 0.01, *** p < 0.001, ns, no significant. M) Proposed model of RA eliciting tumor immunogenicity and enhancing antitumor immunity. This figure was created with BioRender.com. RA specifically bound to TDP‐43 and induced its localization to mitochondria and mtDNA release, leading to cGAS/STING‐dependent activation of NF‐κB and type I IFN signaling, thereby reprogrammed TME. Data are presented as mean ± SD, * p < 0.05, ** p < 0.01, *** p < 0.001, ns, not significant, B–K) one‐way ANOVA test, A,L) two‐way ANOVA test.
