
FIGURE 4.
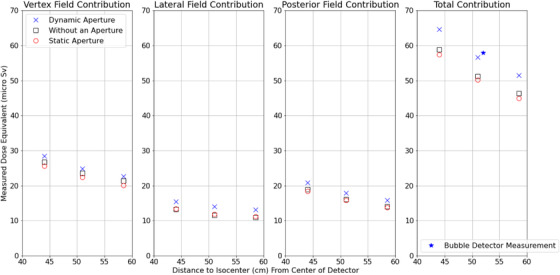
Measurements of the out of field contribution. The blue cross is for the dynamic aperture measurements, the black square represents the measurements where an aperture was not used, and the red circle represents measurements where the apertures were static. The bubble detector measurement for the adaptive aperture field at 52 cm from isocenter is shown as a star. The error bars to demonstrate standard deviation are too small in comparison to the size of the dose measurements.