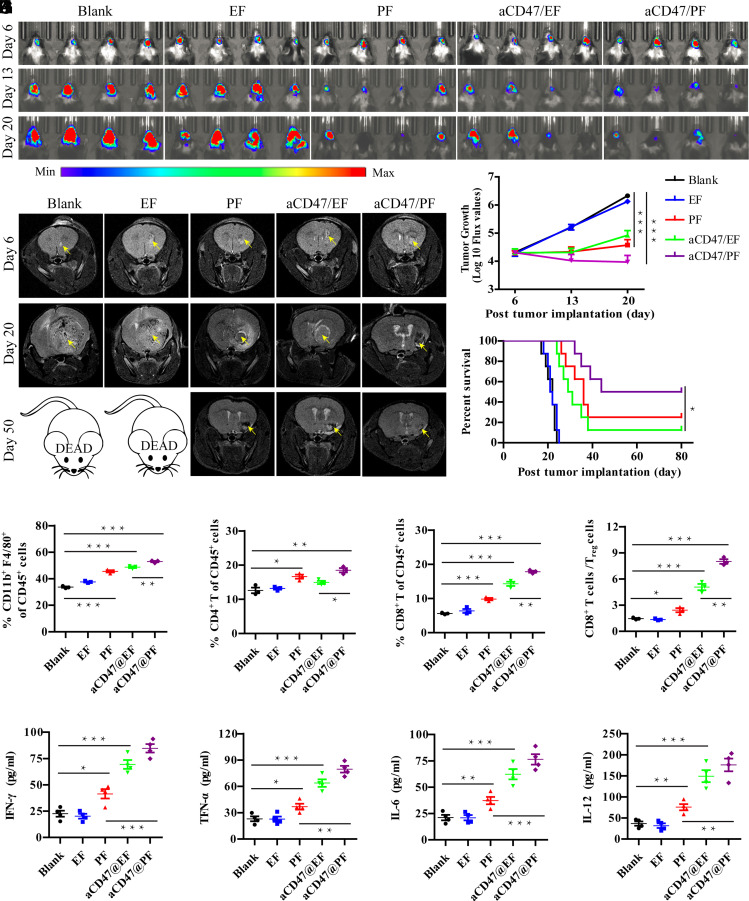
Fig. 3.
aCD47/PF hydrogel elicits regression of GL-261 brain tumors. (A) In vivo bioluminescence images of GL-261 tumors in response to indicated treatments (n = 8 for each group). Four representative mice per treatment group are shown. (B) T2-weighted MR images of GL-261 brain tumors at day 6, 20, and 50 post injection. Lighter zones, indicated by yellow arrows, show tumor location within the brain. (C) Quantification of tumor growth from bioluminescence imaging of the GL-261 tumors in the indicated treatment groups. (D) Survival curves corresponding to indicated treatment groups. Statistical significance was calculated via the log-rank (Mantel–Cox) test. (E) Quantification of macrophage (CD11b+F4/80+), (F) CD4+ T cell, and (G) CD8+ T cell infiltration within the tumor following different treatments. (H) Ratios of the tumor-infiltrating CD8+ T cells to Treg cells in the indicated treatment groups. (I) Secretion levels of IFN-γ, (J) TNF-α, (K) IL-6, and (L) IL-12 at day 7 post different treatments. Statistical significance was calculated using a two-sided unpaired t test. Data are given as mean ± SD. *P ≤ 0.05, **P ≤ 0.01, ***P ≤ 0.001.

