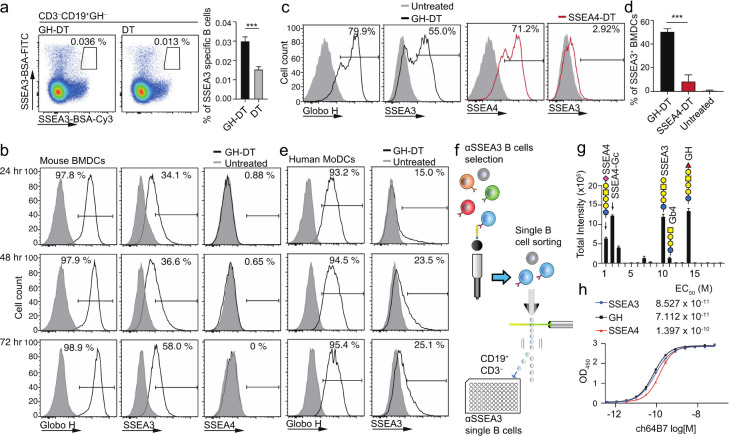
Figure 2.
Oligosaccharide antigen processing and presentation on the cell surface of mouse BMDCs and human MoDCs. (a) B cells targeting SSEA3 glycan (gated on CD3–CD19+GH– cells) were induced 10 days after GH-DT immunization. Statistical significance was shown in the right panel from 5 mice per group. (b) Mouse BMDCs presented GH or SSEA3 glycan, but not SSEA4 glycan, on the cell surface 24, 48, and 72 h after treatment with GH-DT. (c,d) Compared to BMDCs treated with SSEA4-DT, BMDCs treated with GH-DT presented more SSEA3 glycans on the cell surface 48 h after treatment. Statistical significance was shown with 3 mice per group. (e) After treatment with GH-DT, human MoDCs presented GH and SSEA3 glycans on the cell surface at indicated time points. (f) Flow chart for isolation of single B cells that recognize SSEA3 glycan on beads. (g) Binding specificity analysis of monoclonal antibody ch64B7 identified by screen of single B cells from GH-DT-immunized mice using a globo-series glycan array. (h) Binding of ch64B7 to SSEA3, GH, and SSEA4 glycans analyzed by ELISA. Results in (a) right panel, (d), (f), and (g) are mean ± SEM. *** p < 0.001.

