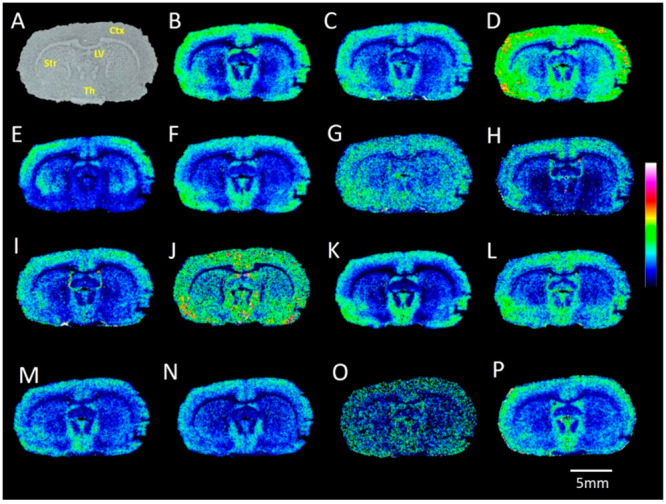
Figure 5.

MALDI-MS images of carboxyl and aldehyde metabolites acquired from a rat brain tissue section. (A) Optical image of coronal rat brain tissue section. Ion images reveal the distributions of AMPP-derivatized (with HATU as the coupling reagent) endogenous metabolites: (B) FA (16:0); (C) FA (16:1); (D) FA (18:1); (E) docosahexaenoic acid (DHA); (F) arachidonic acid (AA); (G) FA (20:1); (H) FA (22:5); (I) FA (18:2); (J) FA (20:5); (K) FA (18:0); (L) FA (22:4); (M) acrolein; (N) malondialdehyde/pyruvaldehyde; (O) HNE; (P) pentadecanal. Ctx, cortex; Str, striatum; Th, thalamus; LV, lateral ventricle. The MALDI–MSI experiments were performed independently using different rat brain sections (n = 4), all of which produced similar results. Data are shown using a rainbow scale (ion intensity scale) for optimal visualization. Lateral resolution, 100 μm.
