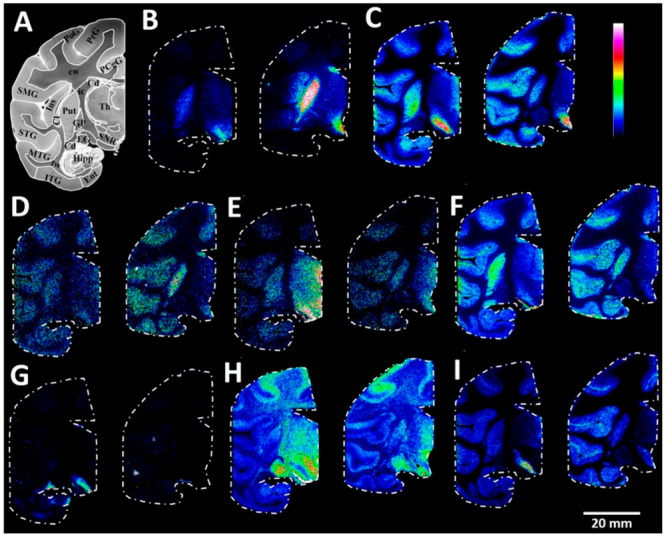
Figure 7.

MALDI–MS images of carboxyl and aldehyde metabolites in the coronal region of primate control and Parkinson’s disease model brain tissue sections. (A) Brightfield image of a macaque brain tissue section at −7.5 mm ac with annotated brain regions. Ion images of (B) HVA (0–50%), (C) GABA (0–50%), (D) DOPAL (0–50%), (E) 5-HIAA (0–30%), (F) GHB (0–80%), (G) glucose/galactose (0–40%), (H) NAAG (0–10%), and (I) FA (20:5)-eicosapentaenoic acid (0–20%) from one MPTP-lesioned (left) and one control (right) animal at coronal level −7.5 mm ac. PoG, postcentral gyrus; PrG, precentral gyrus; PCgG, posterior singulate gyrus; SMG, supramarginal gyrus; STG, superior temporal gyrus; MTG, middle temporal gyrus; ITG, inferior temporal gyrus; Ent, entorhinal area; Hipp, hippocampus; Cd, caudate nucleus; Ins, insula; Cl, claustrum; Put, putamen; GP, globus pallidus, Th, thalamus; ic, internal capsule; LG, lateral geniculate nucleus; tw, temporal white matter; cw, cerebral white matter; SNR, substantia nigra pars reticulata. Lateral resolution, 150 μm.
