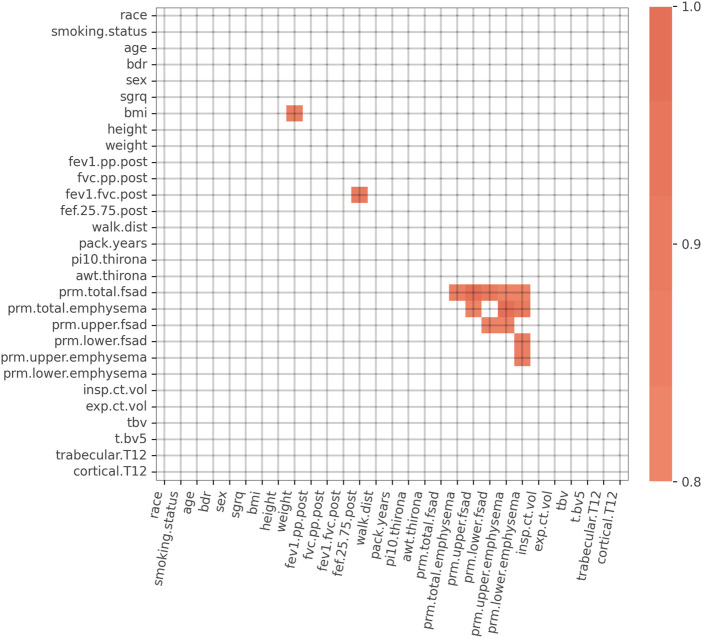
FIGURE 2.
Spearman correlation matrix for the initial 29 variables. Spearman correlations > 0.80 are highlighted in orange. Strong correlations exist between PRM imaging biomarker variables, FEV1/FVC and FEF25-75, and BMI and weight. Abbreviations: bdr, bronchodilator responsiveness; sgrq, St. George’s Respiratory Questionnaire; BMI, body mass index; FEV1.pp.post, post bronchodilator FEV1% predicted; FVC.pp.post, post bronchodilator FVC % predicted; FEV1.FVC.post, post bronchodilator FEV1/FVC; FEF.25.75.post, post bronchodilator forced mid-expiratory flow; walk.dist, 6-min walk distance; pi10.thirona, square root of an airway wall area with a 10 mm lumen perimeter, measured by Thirona software; awt.thirona, segmental airway wall thickness, measured by Thirona software; prm.total.fsad, PRM total fSAD > 10%; prm.total.emphysema, PRM total emphysema > 2%; prm.upper.fsad, PRM upper lobes fSAD > 10%; prm.lower.fsad, PRM lower lobes fSAD > 10%; prm.upper.emphysema, PRM upper lobes emphysema > 2%; prm.lower.emphysema, PRM lower lobes emphysema > 2%; insp.ct.vol, CT-derived inspiratory lung volume; exp.ct.vol, CT-derived expiratory lung volume; tbv, total blood vessel volume; t.bv5, ratio of vascular tree length in vessels with a cross-sectional area less than 5 mm2 to total vascular tree volume; trabecular.T12, average Hounsfield unit (HU) value within the trabecular region of the T12 vertebral body; cortical.T12, average Hounsfield unit (HU) value within the cortical region of the T12 vertebral body.

