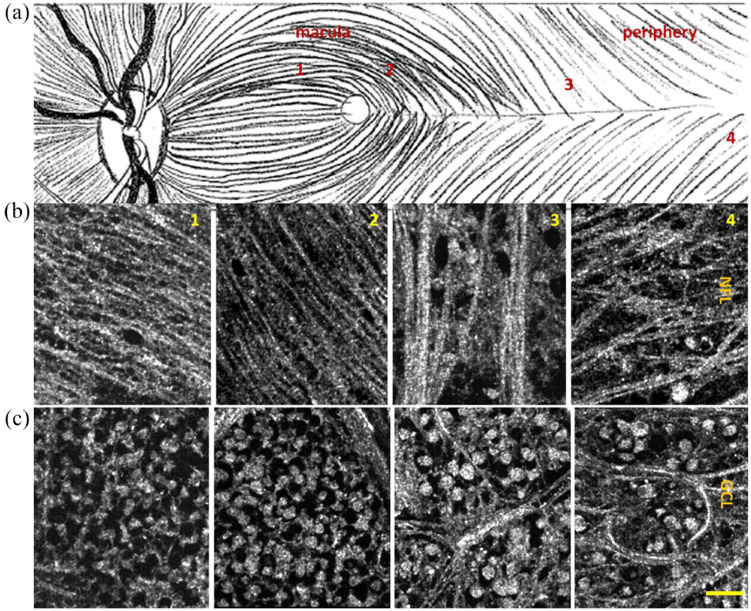
Figure 4.
Full-field OCT images of human ex vivo retina. (a) Illustration of the fundus showing raphe median region running from macula to periphery. One through four indicate approximate zones of en face images in row (b) NFL and row (c) GCL. Scale bar: 50 μm. Republished from the study by Grieve et al. 63

