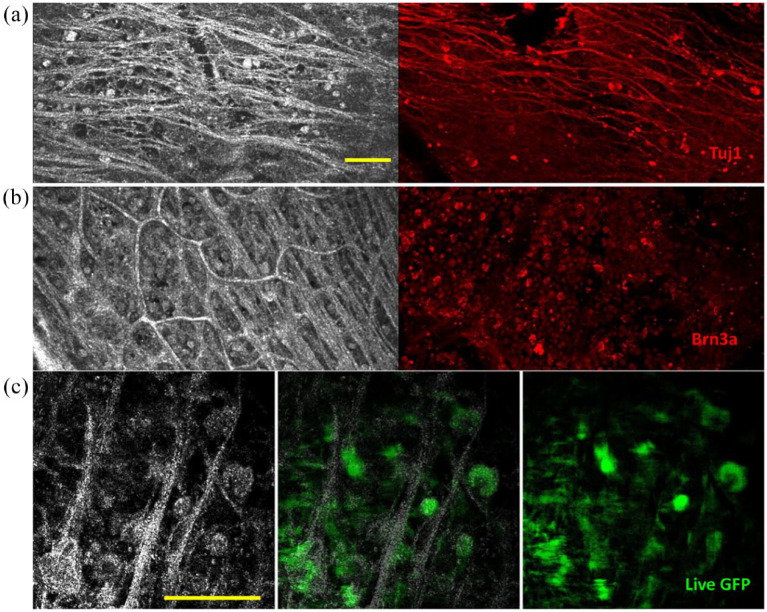
Figure 5.
Full-field OCT and FCM in humans and fluorescence-FF-OCT in primates. (a, b) Full-field OCT (left) and FCM (right) images of the human retina, in subject three. (a) Sparse axons and cells at periphery visible as hyperreflective structures in FF-OCT (left) and similar region with FCM labeled with Tuj1 (red), which labels ganglion and amacrine cell somas and axons; (b) densely packed cells in GCL in a location closer to the optic nerve, where cells, nerve fibers, and capillaries are visible as hyperreflective structures in FF-OCT (left) and in the similar region with FCM (right) where ganglion cell nuclei are labeled with Brn3a (red). (c) Full-field OCT (left) combined fluorescence-FF-OCT (center) and fluorescence (right) images of GFP-labeled RGC somas in live macaque retina using fluorescence-FF-OCT, with pixel to pixel overlay. Scale bars: 100 μm. Reproduced from the study by Grieve et al. 63

