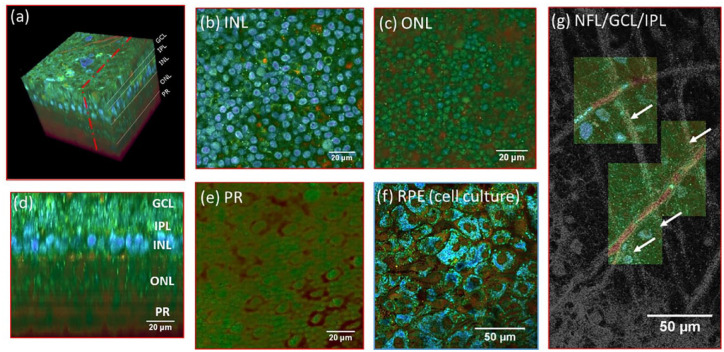
Figure 6.
(a) 3D reconstruction of a D-FF-OCT image stack in explanted macaque retina over a 120 by 120 µm field of view. (b, c, e) En-face images of the (b) inner nuclear layer, (c) outer nuclear layer, and (e) photoreceptor layer. (d) Reconstructed cross-section at the location represented by the red dotted line in (a). The cross-section in (d) was linearly interpolated to obtain a unitary pixel size ratio. (f) D-FF-OCT image of a porcine retinal pigment epithelium cell culture. (g) Overlay of colored D-FF-OCT and FF-OCT at the interface between the layers of the nerve fibers (white arrows point to nerve bundles that are very bright in static and invisible in dynamic mode), ganglion cells (blue and green cells, visible in dynamic mode), and inner plexiform (fibrous network, bottom left, visible in static mode). Samples were maintained in vitro in a culture medium at room temperature during imaging. Reproduced from the study by Scholler et al. 69

