Fig. 4.
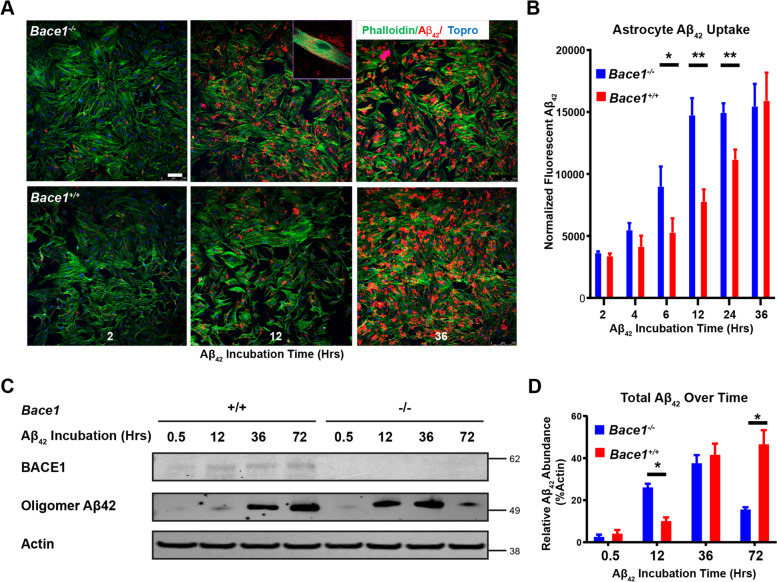
BACE1 deficiency enhances astrocytic clearance of Aβ in vitro. A Confocal imaging of astrocyte primary cultures from BACE1-null and WT perinatal mice pups and treated with 2 μM of Aβ42 tagged with fluorescent Hilyte-555 for indicated incubation times. Stained with phalloidin (green) to mark F-actin and ToPro3 (blue) to mark nuclei. Scale bars represents 10 μm. Inset shows magnified image of Aβ42 within phalloidin marked astrocyte boundaries. B Quantification of Aβ42 integrated fluorescence within phalloidin marked astrocyte boundaries and normalized to number of nuclei and astrocyte area (N = 6, * p-value < 0.05, ** p-value < 0.01; One way ANOVA, with Tukey post testing comparing between time points. C Western blot of astrocyte primary culture lysates from indicated genotypes and treated with 2 μM of aggregated Aβ42 for the indicated incubation times. Images indicate major bands for BACE1, Aβ42 (human, oligomeric), and actin. D Quantification of Western blot Aβ42 band intensity normalized to actin (N = 3, * p-value < 0.05, One-way ANOVA, with Tukey post testing comparing between samples)

